By now, we’ve covered a lot of ground as it relates to working with WordPress and debugging. And this is especially true as it relates to working with tools and plugins available within WordPress. If you’re just joining this particular series, please make sure you’re caught up with the following posts:
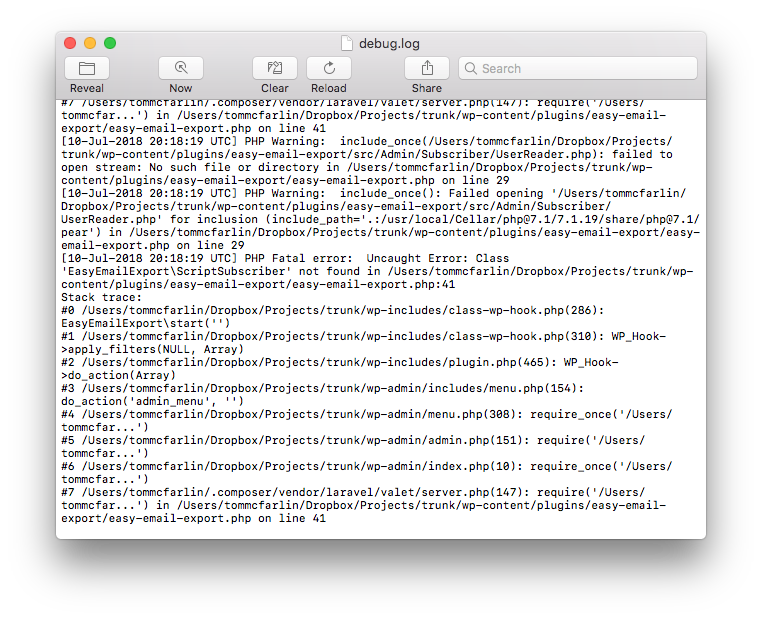
- Reading and Understanding WordPress Error Logs, Part 1
- Reading and Understanding WordPress Error Logs, Part 2
- Basic Debugging Within WordPress
In the previous post, recall that I said the following:
But if you’re looking to get into the world of professional, practical debugging from within your IDE, then it’s important to understand the what, how, and why.
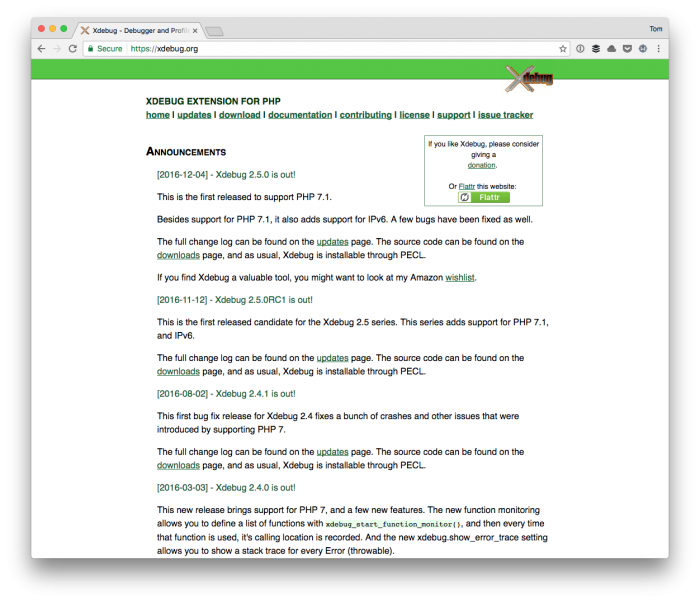
And we’re finally ready to look at what this requires. To get started, however, means that we need to understand a few things about Xdebug, the terminology, and to have an IDE that’s consistent for everyone reading this particular series.
So this is going to be broken into two parts.
- First, we’re going to look at the terminology required for debugging and make sure that we have a proper IDE setup in our development environment,
- Next, we’re going to look at how to ensure we’ve properly installed Xdebug and then wiring it up to our development environment so we can put it to work.
If you’ve read a variety of content throughout this blog over the past few years, some of this may seem familiar. If not, no big deal. Remember the goal is make sure we’re all on the same level as we proceed forward with the work mentioned above and throughout the rest of the series.
With that said, let’s get started.