As we continue to head towards working with direct debugging with Xdebug, we have a few tools at our disposal that allow us to work within WordPress itself. These aren’t meant to be replacements for any other debugging tool, but compliments to them.
I began by discussing this in the previous part of the last series. Specifically, I wrote:
Now though, we need to turn our attention to the plugins that were discussed a few posts ago. After that, we’ll eventually be working our way up to Xdebug.
But next, we’ll look at the tools available to us from within WordPress itself.
Ultimately, the goal is to look at what’s available for us to use to find problems, test code snippets, and profile our work. And several plugins make this incredibly easy (and are quite powerful) as it relates to doing just that.
Debugging Within WordPress
Before getting started with this content, it’s worth noting that there are a plethora of plugins available to help debug and profile your WordPress installation and the work you’re doing within the installation.
This is simply a short list of tools that I find useful and that I think you should have at minimum in your local installation. And to reiterate, these are not replacements for debugging tools. They are compliments to them.
They allow us to do certain things from within WordPress that are expedient (and that are meant to be used in conjunction with error logging and proper debugging). The following plugins will be covered as follows:
- a description of what the plugin does,
- how it looks within WordPress,
- additional plugins that may work well with it.
With that said, let’s take a look.
1. Debug Bar
As stated on the plugin’s homepage:
Adds a debug menu to the admin bar that shows query, cache, and other helpful debugging information.
First, it’s important to remember that you have all of your debug constants set before getting started.
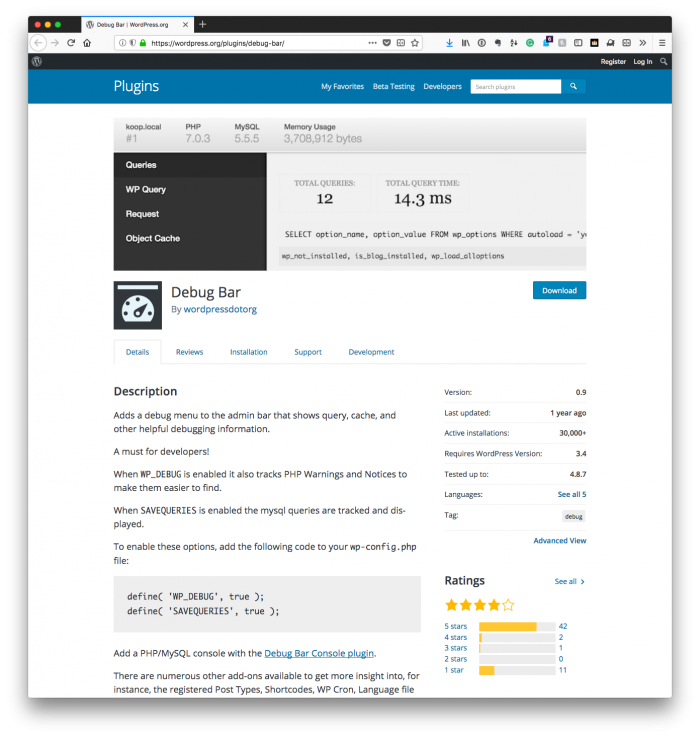
So what’s the purpose of this plugin? Out of the box, it allows us to look at cache hits, misses, and groups regarding the basic WordPress object cache.
This is insightful information that we can use when developing custom solutions, plugins, or application functionality. But it doesn’t stop there because there are plenty of add-ons that can make the plugin more powerful.
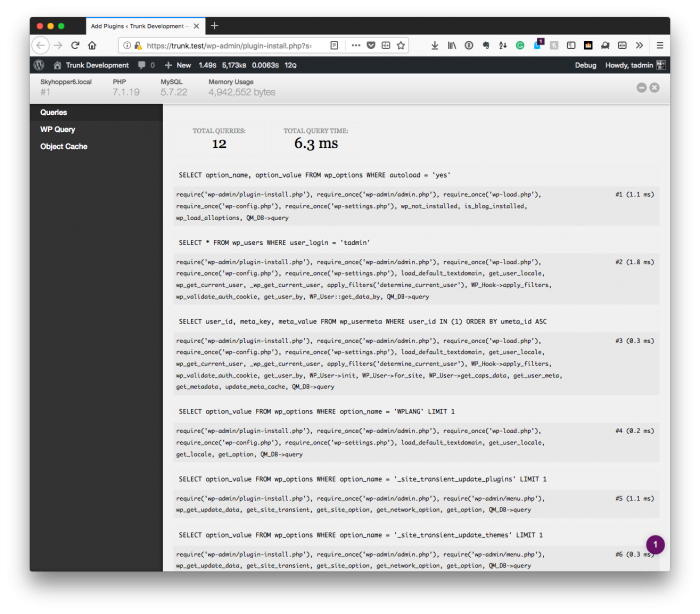
I’ll talk more about one of my preferred add-ons but here’s a running list you can peruse on your own.
See Also…
For the record, I’m not above doing a deeper dive into any of the add-ons above (and I’ll share more advanced ones in the next section), but each one offers more specialized functionality, and I’m looking to give a broad overview of what applies to most projects.
If you are interested, you can always contact me to talk more about a given add-on.
2. Debug Bar Console
This is an extremely simple add-on regarding how its described.
Adds a PHP/MySQL console to the debug bar.
But it’s so useful because of the nature of what it allows us to do. I’ll show you what I mean momentarily.
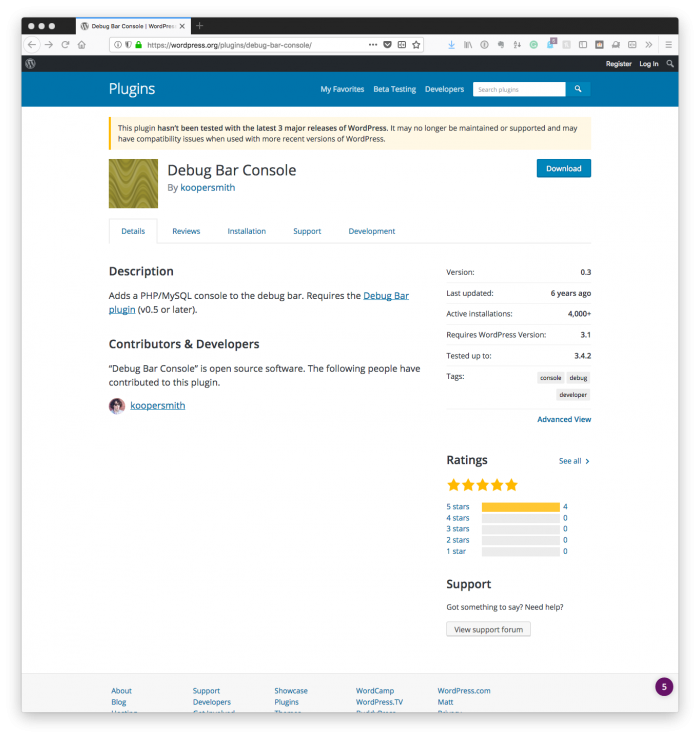
You can read much more about each of the plugin in the plugin handbook. Meanwhile, if you’re looking for recommendations on add-ons that I regularly use, see the following list.
But what’s it look like to use this particular plugin? Let me give a few examples. All of the screenshots that you’re going to see are directly from within the WordPress administration area.
Executing PHP Within WordPress
The add-on offers two tabs within the Console one of which is PHP. From here, you can execute any valid PHP that you’d like.
Here, you’ll notice that I’m using $wpdb to show how to execute something using the facilities of WordPress.
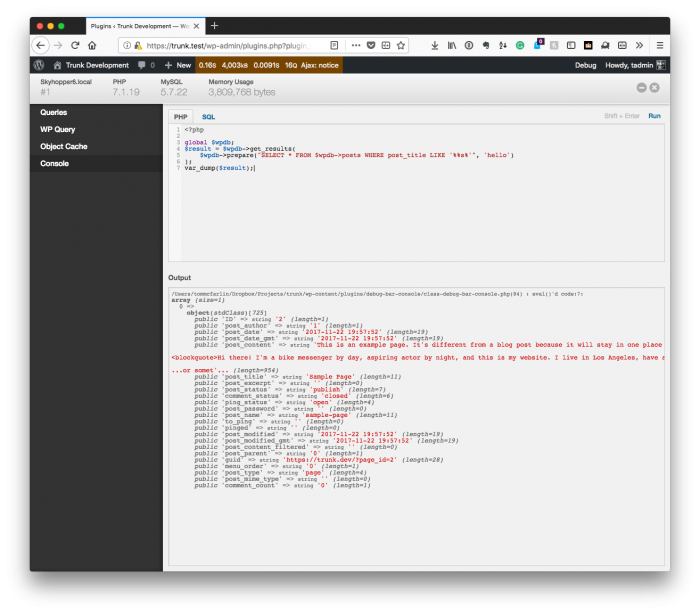
Notice, however, that if you try to execute invalid PHP, you may not see anything show up in the output.
Executing SQL Within WordPress
Let’s say I want to execute the same query as above but as raw SQL. To do that, I can do so using the SQL tab in the plugin:
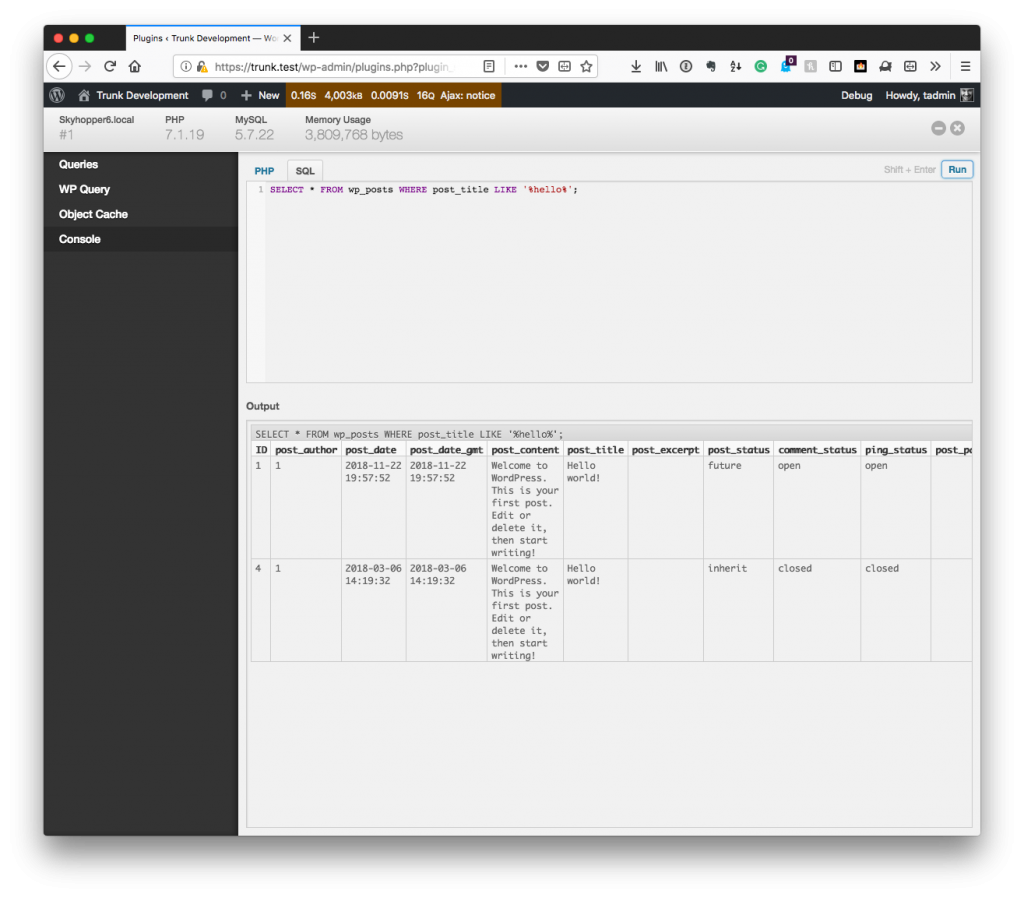
And you’ll notice the result that’s output is slightly different than a PHP. Instead, it’s in a table format much like you’d expect if you were running a query against the database using a database front-end.
See Also…
As mentioned earlier, these add-ons get more advanced. And if you’re looking for more information about these plugins, then don’t hesitate to contact me to see about writing more about them.
3. Query Monitor
This is a powerful plugin that offers the following:
Query Monitor is the developer tools panel for WordPress. It includes some advanced features such as Ajax and REST API debugging, and the ability to narrow down its output by plugin or theme.
This will add an extended menu to the Debug menu offered by Debug Bar that gives us insight into:
- database queries run on any given page along with their order and the amount of time it took to run each one of them,
- any information about the WP_Query object that is relevant (some pages don’t have anything, some will)
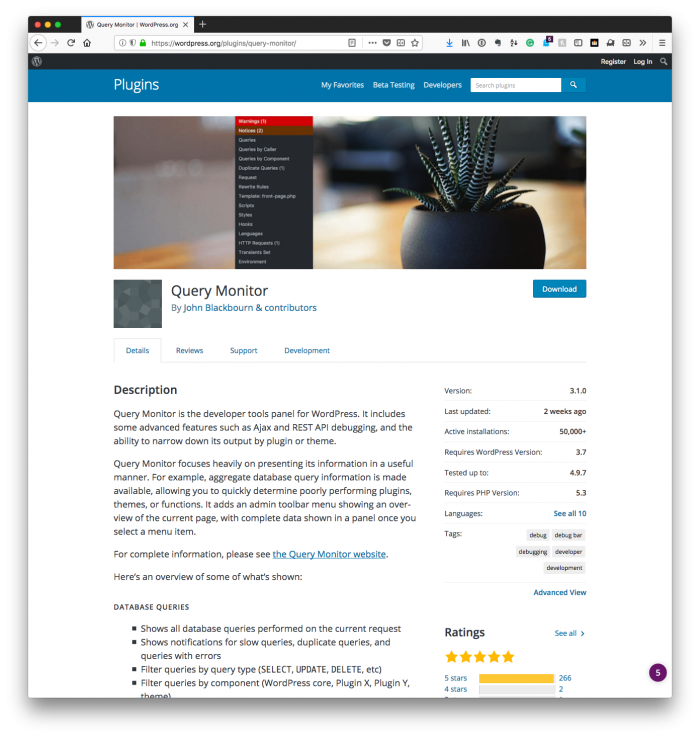
Furthermore, we gain insight into:
- hooks,
- theme information,
- PHP errors,
- request information,
- JavaScript,
- CSS,
- language settings and text domains,
- HTTP requests,
- Ajax,
- and more.
This plugin makes a lot of information available right from the WordPress dashboard. It can be overwhelming at first, and you also have to learn how to understand the information that it’s presenting.
Luckily, the team of contributors has done a great job of making it easy to understand what’s happening. For example, if you get a PHP notice or warning, then you’ll get color-coded information based on the severity of the problem before you even look at the information that it provides.
Again, if you’re interested in a deeper dive into this particular plugin, let me know.
And Next, Debugging
With the above three covered, you should be well-equipped to handle quite a bit within WordPress. But if you’re looking to get into the world of professional, practical debugging from within your IDE, then it’s important to understand the what, how, and why.
And that’s what we’ll begin looking at in the next post.
