If you’ve just happened to join up on the membership of the site and are pursuing content specifically for The Independent WordPress Developer, I recommend reading the previous post – at the very least – to prepare for content in this post.
If, however, you’re looking to catch up on the previous article, here’s a short list of everything that’s been written thus far:
- Local Development for the Indie WordPress Developer
- Databases and Tools for the Indie WordPress Developer
- Installing WordPress for Local Development
As we prepare to move into talking about more advanced topics such as debugging and IDEs, it’s first worth noting the tools we have tools available that we can install within WordPress that will help us with debugging issues during development.

Further, these issues are not related to strictly PHP issues. These also include JavaScript issues. And to take it one step further, there are ways in which we can configure WordPress natively so that it outputs errors directly to our browser.
So before we look into error logs, IDEs, Xdebug, and so on, we’ll take a look at what we can do within WordPress itself.
Native WordPress Debugging Tools
The native WordPress debugging tools are a combination of two things:
- the options we can set in the WordPress configuration file that allow us to see information written to screen,
- several plugins that will help us to work with PHP and JavaScript files from within the WordPress administration area
For the second point above, I want to be clear that there are a lot of available plugins for something like this; however, I want to keep the installation as lean as possible so that we aren’t inundated with too much information.
Instead, I want us to have the information we need to test and evaluate our work but that we have only what we need. At least for now. Perhaps we’ll talk about advanced topics in future posts.
With that said, let’s get started.
WordPress Configuration
Before worrying about configuration, WordPress itself provides some different options we can configure in the `wp-config.php` file. These are well-documented in the Codex, but I know from experience of emails of others that the information can be a bit tough to sift through.
First, it’s important to note the following (as quoted from the WordPress Codex):
WP_DEBUG is a PHP constant (a permanent global variable) that can be used to trigger the “debug” mode throughout WordPress. It is assumed to be false by default and is usually set to true in the wp-config.php file on development copies of WordPress.
This does assume you understand PHP constants. If not, check out the manual here (it’s pretty straightforward). The short of it is as follows:
A constant is an identifier (name) for a simple value.
So I’m going to do what I can to provide the configuration options as distill it as much as possible.
First, in the wp-config.php file, you’ll want to change the line that reads:
That’s not all, though. There are a few more things to add that will enhance the debugging experience:
If you’re following along in the But what does each line mean? Here’s as succinct explanation as I can give right now:
- WP_DEBUG. This will display any errors and warnings thrown by PHP when running WordPress. Running the application by itself shouldn’t show any problems; however, running it alongside various plugins may be a different story depending on the quality of the plugin.
- WP_DEBUG_LOG. This is one of my favorite constants, and it writes all of the output to the log in a detailed manner. I’m going to cover this in an upcoming post but, for now, know that this is something that I think should always be set in your development environment.
- WP_DEBUG_DISPLAY. This is one that you can set to true or false (though I prefer true). It compliments the previous setting by allowing you to see the messages in the browser that are also written to the blog. I don’t know if this is something that you’ll find beneficial or not. If you’re not prepared to go through stack traces and more detailed information, you may want to consider setting this one to true.
- dislay_errors. The Codex mentions that you can set this equal to false, but I think it should be set to true as a way to enable the errors and warning.
- SCRIPT_DEBUG. WordPress core uses minified versions of CSS and JavaScript files. Turning this setting off will allow you to view all of the contents of the files in the original form. This is particularly useful if you’re going to be contributing to Core or working to JavaScript included in Core.
- SAVEQUERIES. This is a slightly more advanced setting, in my opinion. In short, it’s going to take all of the queries that run against the database and save them to a PHP array that you can later analyze. It
Now that we’ve covered WordPress configuration, what about plugins?
Plugins For Debugging
When I say that the repository is full of plugins for this, I mean it. In fact, if you’re new to WordPress development, I’d not recommend going to look for things to install.
It can quickly become overwhelming, you risk not understand what some of them do, and potentially lead you down a path in which you end up borking your installation.
Rather than do that, I recommend taking a look at the following plugins (reading their description first, of course) and then going from there:
- Debug Bar. This plugin alone adds a menu to the admin bar that will allow you see the query, cache, and other information. It does require that WP_DEBUG and SAVEQUERIES as outlined above are enabled.
- Debug Bar List Script & Style Dependencies. This is an add-on to the above plugin that will allow you to debug further JavaScript and CSS styles that are running within the context of WordPress.
- Debug Bar Console. This plugin is one that you should use with hesitation. At the very least, it allows you to execute PHP and MySQL from within WordPress itself. I don’t recommend this plugin unless you’re very comfortable with either of the two languages. Still, if you are, this is something that can be powerful for prototyping a function or a query before building it into your plugin.
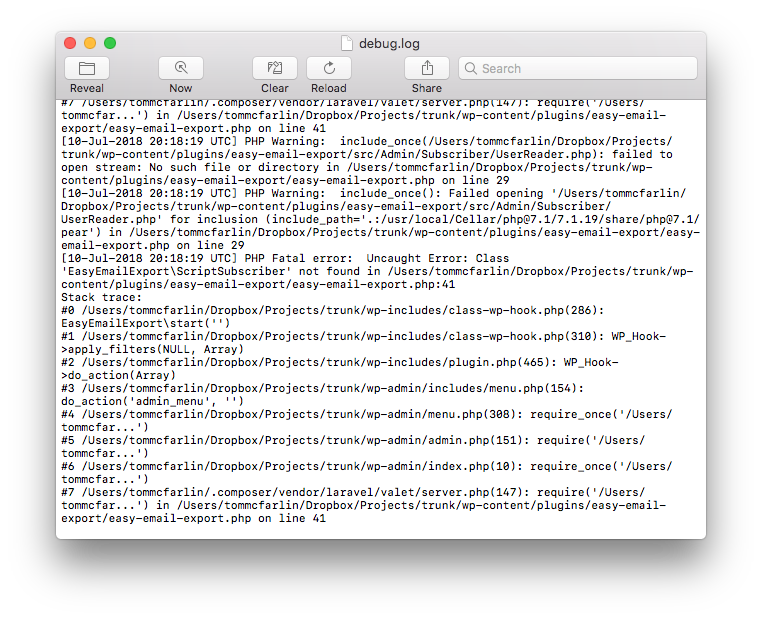
Examining Error Logs
In the next post, we’ll start looking at what’s necessary to examine the error log that’s generated by WordPress and how to understand the information we see.
Furthermore, we’re going to look into what’s necessary to use the plugins that are outlined in this post. After that, we’ll move on to even more advanced tooling.
But one step at a time, right?
For now though, configure your installation as outlined above, install the linked plugins, and then do what you can to explore how they work, what you may see on the screen, and how this can impact and positively benefit your development.
Yes, there may be a bit of a learning curve. But that’s why we’re taking this slow. There’s a lot to learn, and we’ve plenty of time to cover all of the ground that’s necessary.