By now, we’ve covered a lot of ground as it relates to working with WordPress and debugging. And this is especially true as it relates to working with tools and plugins available within WordPress. If you’re just joining this particular series, please make sure you’re caught up with the following posts:
- Reading and Understanding WordPress Error Logs, Part 1
- Reading and Understanding WordPress Error Logs, Part 2
- Basic Debugging Within WordPress
In the previous post, recall that I said the following:
But if you’re looking to get into the world of professional, practical debugging from within your IDE, then it’s important to understand the what, how, and why.
And we’re finally ready to look at what this requires. To get started, however, means that we need to understand a few things about Xdebug, the terminology, and to have an IDE that’s consistent for everyone reading this particular series.
So this is going to be broken into two parts.
- First, we’re going to look at the terminology required for debugging and make sure that we have a proper IDE setup in our development environment,
- Next, we’re going to look at how to ensure we’ve properly installed Xdebug and then wiring it up to our development environment so we can put it to work.
If you’ve read a variety of content throughout this blog over the past few years, some of this may seem familiar. If not, no big deal. Remember the goal is make sure we’re all on the same level as we proceed forward with the work mentioned above and throughout the rest of the series.
With that said, let’s get started.
Installing Xdebug, Part 1
As mentioned above, this set of posts is going to serve one of two purposes both of which can be succinctly described (the second of which will be described in the next post):
- Debugging Terminology
- Installing an IDE
Though many reading this will already be familiar with some of the terminology (especially if you’ve used client-side tools or even server-side tools before), and you already have an editor of choice, it’s important to make sure that we are at least working with a consistent foundation.
If you’re confident in your skills across the two points mentioned above, then the next post is likely going to be more interesting for you. If, on the other hand, this is getting into new territory for you, it should lay the foundation for everything that you need to make sure you’re successfully debugging projects in WordPress.
Further, it’s going to make sure that you have a consistent set of tools with which to work so that we can continue to push forward with a standard set of tools to create the most productive development environment possible.
1. Debugging Terminology
Depending on your background, you could make the case there are anywhere between five and seven terms each of which are related to debugging. I’ve outlined then before in other posts on this site. Each time, however, I’ve done so with a little bit of a different take on the content.
In this post, I’m aiming to try to make this as accurate and precise as possible so that it provides a consistent reference that we’ll be able to use in the posts (and in work) to come. As it stands now, here are the terms that I think everyone should know as it relates to their debugger.
- Breakpoints. These can be considered the fundamental blocks of debugging. Simply put, they are places in the code that you want to pause execution so you can examine what’s happening in the code. Perhaps this has to do with variables; perhaps it has to do with functions, perhaps it has to do with something else. Regardless, this is important because you’re telling the program “hey, I want to stop the program from executing right here on this line so I can investigate the state of the program.”
- Watches. These are function calls, variables, or other places in the code that may be set such that we’re able quite literally to see values change throughout execution. If we’re talking about functions, then we could be referring to the values of arguments as they’re set and manipulated within a function. If we’re talking about variables, we’re talking about variables; then we’re talking about the values they hold at any given point during the program’s execution. This can be when we set a specific breakpoint, or it can be whenever we step through the code and keep an eye on the status of the variable throughout the program’s execution.
- Start. This action simply tells the debugger to start monitoring the web server. Essentially, it’s keeping an eye on everything that’s happening within the program and, if any breakpoints are set, it’s prepared to stop execution and allow us to take a look at what’s happening with the state of the program. You can technically start a debugging session and not do anything whatsoever. It’s not exactly productive, but it’s possible.
- Step Into. Assume for a moment that you have a breakpoint set just above a function call or on a function invocation. This allows us to step into the function to monitor the value of each argument, how they are manipulated within the function, what the function returns (if anything), and everything that happens within the function.
- Step Over. On the other hand, assume that you’re walking through the function and you’re not sure you want to dive into the function. Perhaps you’re interested only in the values that the function returns or the state of the program after the function has run, but you’re not interested in what’s happened within the function. In essence, you treat it as a black box. That’s what it means to step over a function. That is, you let the function run without stepping into it to watch it work.
- Step Out. This particular aspect of debugging is useful whenever you find yourself in a function and you’re ready to return to the main line of execution because you’ve seen all you need to see. Perhaps you’ve witnessed the values of a variable changing, maybe you’ve seen an algorithm do enough work to know that it’s done what you want. Whatever the case, this will allow you to step out of the function, aptly named, and then move into the
- Stop. Just as start tells the debugger to start listening to the server, paying attention to breakpoints, and displaying information on the progress of the application, stop does just the opposite. It tells the debugger that we’re done listening, watching, and paying attention to the state of the program. This doesn’t mean the program stops – just the debugger. So if you’re done with paying attention to all of the information provided by the debugger, then you’re likely in a position to stop the debugger.
One final note I’d like to make is that PHP is unique in that it offers a variety of publicly accessible variables such as $_GET, $_POST, $_REQUEST, and so on. These are also variables that are available to us that we can watch. It’s not just limited to what we have in written in our code.
This is especially useful as we’re looking at data across page reloads, Ajax requests (such as during GET and POST actions), and so on.
2. Installing Xdebug
Although it’s likely evident from previous posts in this series, I’m going to be using Visual Studio Code as my IDE of choice. If you don’t have one, then this is one I do recommend. If, however, you do have an IDE with which you’re comfortable using then this is one that I recommend.
- Code is always under development,
- has an active economy of extensions,
- works well with a variety of languages, tools, and so on,
- is lightweight and plays nicely with the various things we may be used in WordPress development (such as PHP, HTML, and JavaScript).
Furthermore, Code also has solid support for Xdebug. To make sure that the debugger is properly installed, though, we need to ensure that we have the extension installed with our installation of PHP, that it’s available across our system, and that can be executed within our IDE. We’re going to be looking at doing this, but first, we need to make sure that Xdebug is properly installed.
Installing Xdebug
Installing Xdebug is easy. From within your terminal session, you’ll need to execute the following command:
Once you do, you’ll notice several things happening within the terminal window as the installation takes place. Unless you’re particularly interested, you don’t need to worry about what it’s doing until it returns you to the command prompt.
At this point, the Xdebug module has been installed; however, you’re going to need to tell PHP that it’s installed and where it can find the module.
To install the extension with your current version of PHP, it’s important to know which version of PHP you have installed. If you’re using a package manager, then there maybe multiple versions and you’re going to need to tell that particular version’s configuration file where to find the module.
Conversely, if you have a single version installed, then you’re going to need to tell a single version of PHP where it’s installed. First, you can find where Xdebug exists on the file system using this command:
Then you’re going to need to update the configuration file for your PHP installation. To do this, simply run php -v from the command-line and it will tell you which version you’re running. From here, you’re going to need to locate the initialization file for the version of PHP that you’re using. If, when running php -v, you come back with something like this:
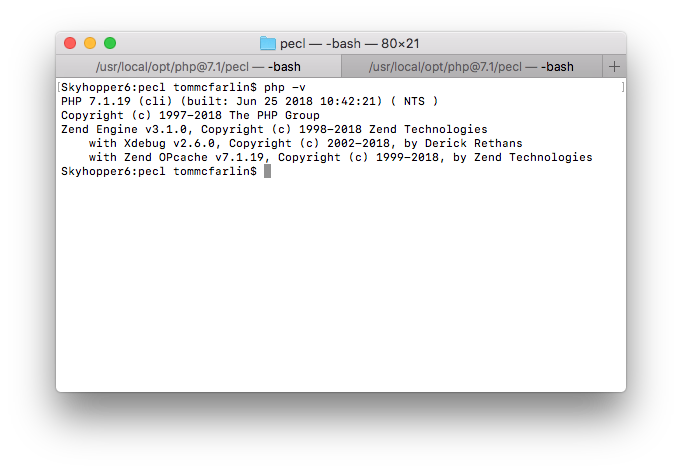
This tells us that we’re running PHP 7.1.19 (though your version may vary). From here, we know to look for a certain PHP configuration file for this version of PHP. To do this, look for php.ini in the /usr/local/etc/php/7.1/ directory on your system (though the exact version number may vary).
From there, open the file and then add the following line of code:
This will tell PHP where Xdebug resides so that it can be used within your work.
Testing The Installation
To verify that the installation has gone correctly, you can run the following code in your terminal:
And then you should see the something like the following output to the screen:
Notice that in the screenshot above, you see the following:
with Xdebug v2.6.0, Copyright (c) 2002-2018, by Derick Rethans
This means that the module has been installed and that PHP is aware of it.
Configuring Your IDE
In the next post, we’re going to look at tying Xdebug into our IDE. Assuming that you’ve followed the steps in this post and that all has gone well, you should be good to go as it relates to preparing to debug WordPress projects.
Until we have it running within an IDE, though, it’s not as useful (or it’s more difficult than it has to be). So next week, we’ll look at exactly how to do that.