Now that Xdebug is installed with your local installation of PHP, it’s time to wire it up to the IDE. This provides us with all of the advantages that Xdebug has to offer.
That is, it allows us to:
- set breakpoints,
- step through our code,
- and watch variables
All the while the program is executing. This means that while is a page is rendering, we’re able to set points in our codebase where we can see what the server is doing with our code.
So, sure, even though it’s called debugging to remove bugs, it can also give insight on how a WordPress-based application, theme, or plugin is executing and can help us gain a better understanding of WordPress core.
Installing Xdebug in Visual Studio Code
At this point, you should have the following environment set up on your local machine:
- Valet (which includes Nginx and MySQL and related tools)
- WordPress
- Visual Studio Code
- Xdebug
The remaining tasks for all of the above involve tying Xdebug into Visual Studio Code so we get a literal representation of how WordPress (and thus, our work) is performing, what it’s doing, and so on whenever it’s running in the browser.
With that said, let’s get started.
[restrict paid=”true”]
1. Installing the Necessary Extensions
First, let’s make sure that the PHP Debug Extension is installed in Visual Studio Code. From the Extensions menu in the sidebar of the IDE, search for PHP Debug, and you should see a screen like the following.
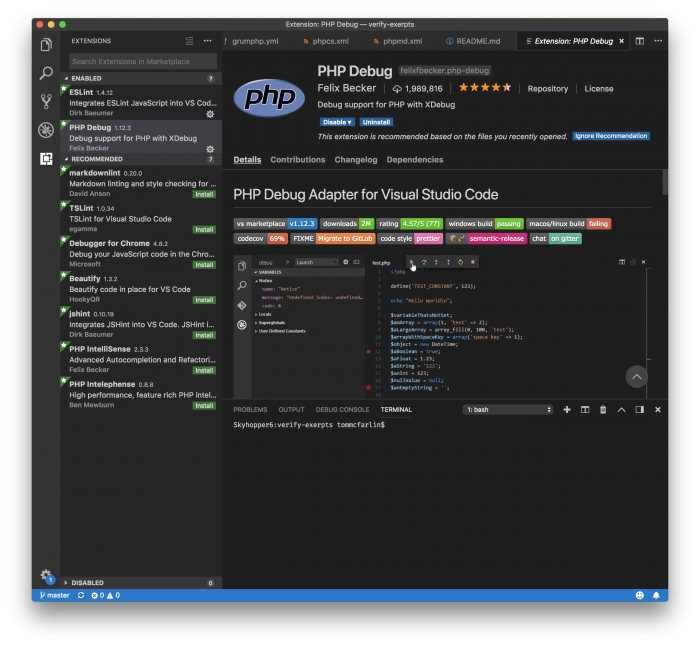
If the extension is not already installed, go ahead and install it. You may need to restart Visual Studio Code for the new extension to take effect.
From here, there are a few additional configuration settings that we need to verify before attempting to debug any code.
2. Configuring Xdebug (Even More!)
Recall from the previous post we needed to include Xdebug in our php.ini file. Specifically, we had to add the following line of code to enable Xdebug:
Now we need to do a little bit more work.
- we’re going to need to add a line of configuration to the php.ini file referenced in the last post,
- we’ll need to set up a demo script to make sure that there’s a proper Xdebug section,
- we’ll need to configure Visual Studio Code
Fortunately, all of the above are relatively quick tasks. First, the line of configuration that you’ll want to add to your file is as follows:
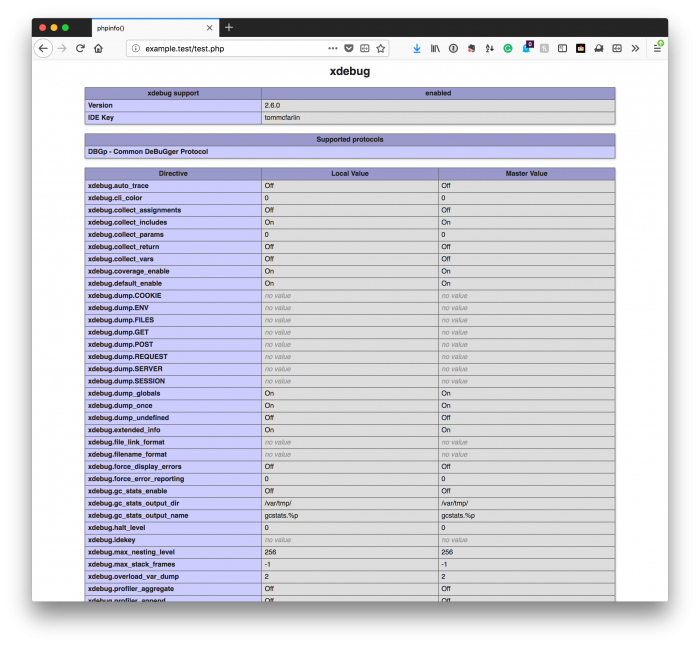
Next, set up a demo scrip and hook it up with Valet. You can do this easily by creating a directory on your desktop, creating something like test.php, and then add phpinfo(); to the file.
After that, link the directory and restart Valet. I happened to name my directory example and dropped a test.php file in the directory.
Permitting everything is configured correctly, you should be able to load the file in your browser and see something like the following:
And now we need to configure Xdebug. So assuming that all of the above has gone well and the extensions are properly installed and running, working with Visual Studio Code should be easy.
Naturally, we’ll need a demo script that we can test, so I’ve written up something that’s trivial but that will give you an idea as to what to expect when setting breakpoints and what not.
Now let’s turn our attention to the IDE. In Visual Studio Code, click on the Debug icon that’s just above the Extensions icon and just below the Source Control icon.
In the sidebar at the very top, you’ll notice that there’s a play button. Next to that is a dropdown list. It may read “No Configuration.” If that’s the case, and I’m going to assume it is, there are some very specific steps you’re going to need to follow to ensure that debugging is working correctly.
1. Open the Script’s Directory
You’re going to need to make sure you’re in the script’s directory in Visual Studio Code.
That is, it’s not enough to make sure that you just have a file open. Visual Studio Code needs to know out of which directory you’re working (because is creates a hidden .vscode directory within the parent directory).
2. Create the Launch Configuration
The default launch configuration should work out of the box, but it’s predicated on the previous step.
Once you’ve opened a directory (in my case, the one that contains test.php) in Visual Studio Code, launch the command palette (you can do this via a shortcut that varies from OS to OS or by using the Help menu and then choose Command Pallete).
Once it appears, enter > launch.json, and it will give you the option to view the launch.json file. Out of the box, it should look like this:
At this point, the Debug menu should have something like Launch Currently Open Script next to the play icon. If it doesn’t, then it will give you the option to select something such as PHP (since we have the extension installed).
If so, select that option.
3. Set Some Breakpoints
Now it’s time to see the debugger in action. At this point, go ahead and launch a browser window with your test script.
Mine is simple:
After that, hope over into your IDE and then click on the left pane to the left of the line number. This will set some breakpoints.
Here’s an example:
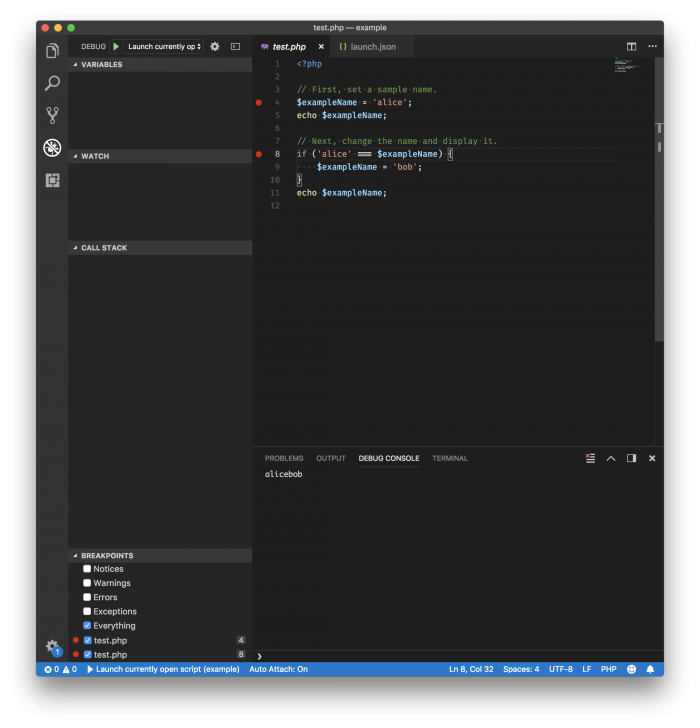
Now click the Play button for the debugger. Immediately, you should notice the status bar turn orange and some debugging controls (for Continue, Step In, Step Out, Restart, and Stop). We’re not interested in these at the moment as we’ll take a deeper look into these in the next post.
Notice also that your left-hand pane has some information about variables, watches, and so on. If you’ve set breakpoints on your local variables, then you’ll notice $exampleName is highlighted but likely uninitialized.
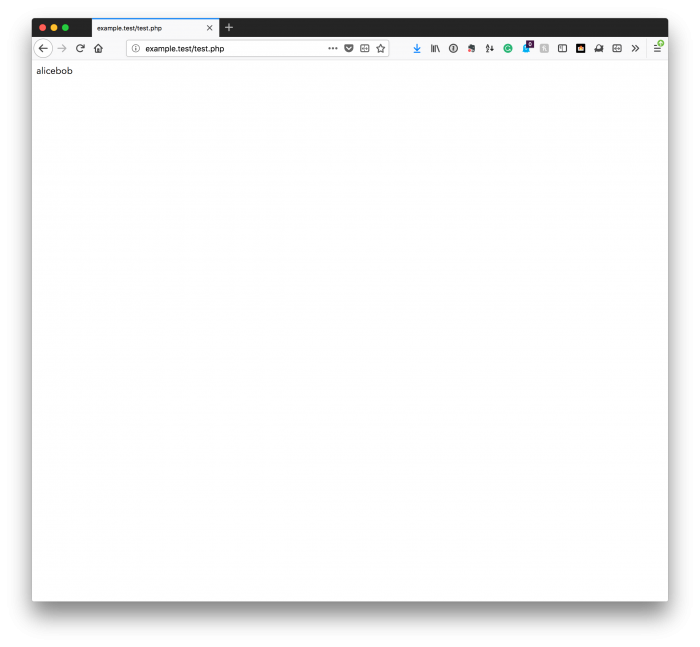
Click the Play button in the new controls that have appeared, and it should run to the next breakpoint.
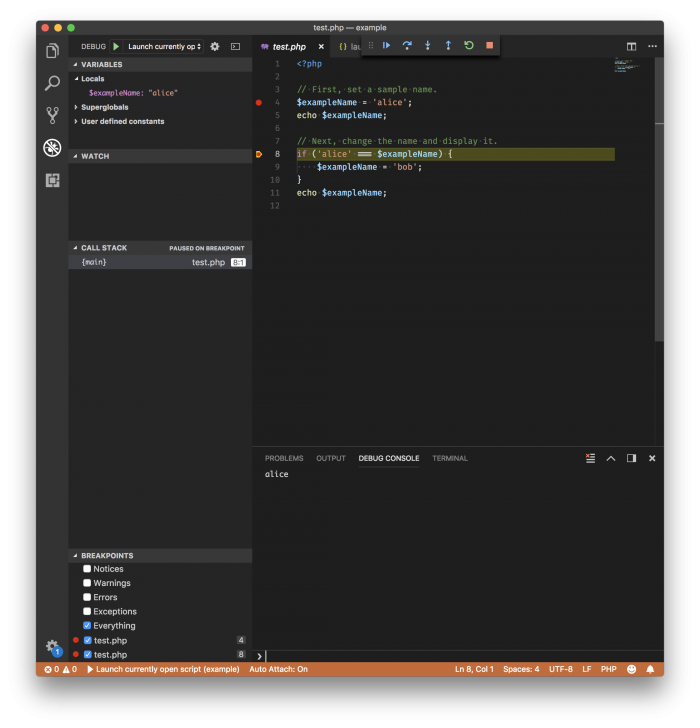
The line will now be highlighted and, in the debugging pane, the $exampleName will be given a value. In my case, this is alice.
You can continue to play around with this as much as you’d like to get a feel for how the debugger works.
[/restrict]
Next Time, Screencasts
Debugging is powerful, but can be daunting in many ways. Starting in the next post, I’ll begin sharing some screencasts that walk through how to:
- debug functions and variables,
- change values on the fly,
- work with the debug console,
- and more.
These will take a bit more time because they will be videos outlining how to do this, but the benefit should be great.
If you’ve not had a chance to catch up with all of the content in this series yet, I highly recommend it.
📣 A Note For Member Perks
Note, however, before the next post around screencasts and the next installment of this series, I have some announcements to make specifically for members of the site that include discounts on WordPress-based software.
I’ll cover more about that next week.