Often, there are little idiosyncrasies that come with learning anything new. Thus, an IDE is no different.
And when it comes to learning a new IDE and how to use a debugger with it, there can often be small things that need to be adjusted or configured so that they help streamline your development.
For me, it comes with some of the default behavior of Xdebug. That is, if you’ve ever installed a new IDE and set it up to use Xdebug, you’ve likely experienced the behavior of having it start on the very first line of your web server or your application.
And this can be an annoying albeit preventable setting. If you’re using PhpStorm, here’s an easy way to fix it.
The First PhpStorm Breakpoint
First, I want a couple of notes on my setup:
- I’m currently using Valet as my web server,
- I’m using PhpStorm as my IDE,
- I’m using Xdebug as my debugger.
In other posts, I’ve talked about using editors like Atom and Visual Studio Code and using MAMP. If you’re using PhpStorm, then the steps should be the same; however, you may notice that the problem depends on which web server you’re using.
For example, if you’re using MAMP then Xdebug will often start on the first line of WordPress. If you’re using Valet, then the debugger will often start on the first line of Valet.
Regardless, it’s not stopping on the first breakpoint you’ve set, and that’s what this is about addressing. Simply put, here’s how to adjust settings in your IDE so that the debugger stops on the first PhpStorm breakpoint and not the first line of your server or app.

If you’re using macOS:
- Click on PhpStorm
- Then click on Preferences
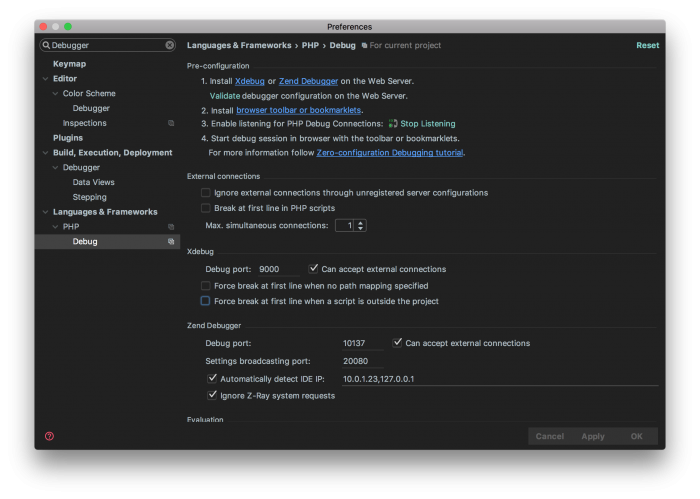
- In the search field, type Debugger
- Locate Debug under the Languages & Frameworks header
From there, look for a checkbox that reads:
Force break at first line when no path mapping is specified
And uncheck it. From there, restart your debugger (which should be Xdebug), and then PhpStorm should start at your first breakpoint rather than the first line of your web server or WordPress.
