TL;DR: Though knowing how to use a debugger is useful, it can be overkill for some of the work that we’re doing. In this article, we’ll look and see what debugging functionality Ray provides and how we can use it when traditional debugging may be overkill.
⚠️ If you’ve not already set up your environment, please read this post and make sure you have the free version of Ray installed.
Debugging Functionality in Ray
A Primer on Debugging
Before looking at the debugging functionality Ray provides, I want to cover the traditional terms that are used when using debuggers such as Xdebug so we have some orientation on what Ray does and does not provide.
- Breakpoints are areas in the code that you can tell the debugger to halt execution whenever a program is running. Literally, it’s a point where we break execution to take a look at what’s happening the in the code, evaluate variables, etc.
- Watches are when you set aside variable in an area of the debugger to see what it’s value is over the course of execution.
- Step In is what you do when you land on a function call and decide to step into a function to see what’s going on. It’s an optional activity but it may help give insight as to what something is doing with the data you’re passing into it.
- Step Over is like Step In except you do the opposite – you step over the function call. The function still runs and performs whatever task(s) but it’s treated more of a black box – you don’t know what it did; you just experience the result.
- Step Out is what you can do whenever you’ve stepped into a function, have seen enough to understand what’s happening or decide that you no longer to be in the function, and step out of it. The function will resume its execution but you want be evaluating the functionality of each line.
With that said, we should have a solid foundation for what debugging is and now we can look at what Ray offers and how we can perform some basic debugging functionality with the application.
Debugging with Ray
In addition to the material we’ve already covered, Ray offers one piece of functionality very similar to breakpoints: Namely, we can pause execution and resume execution of our script.
Initially, this seems simple. But when you couple this with some of the material we’ve already discussed, we can get a pretty clear picture as to what’s going on with our code. Here’s the thing: Whenever you pause execution and then resume execution, you can insert another pause statement as well as instruct Ray to render the values of whatever it is you’re looking to evaluate.
Pausing Execution
Given the work we’ve done thus far, let’s introduce a simple pause call in the code so we can see how Ray behaves. Then we’ll get more advanced from there.
Let’s look at a few examples in the plugin on which we’ve been working. in the getUserCapabilities function, just before the foreach loop starts, let’s place a pause statement:
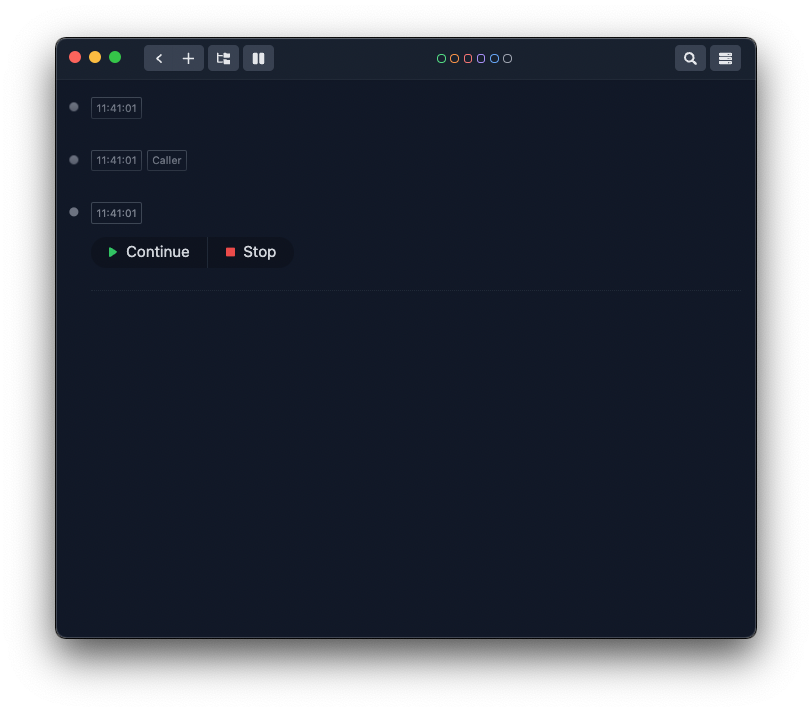
Remember to login to your WordPress installation, refresh a single post page, and refresh Ray. You should see something like this (assuming all of your code is the same as what the plugin contains at this point in time).

In the screenshot above, I’ve collapsed the output of other Ray function calls to make it easier to see our current work.
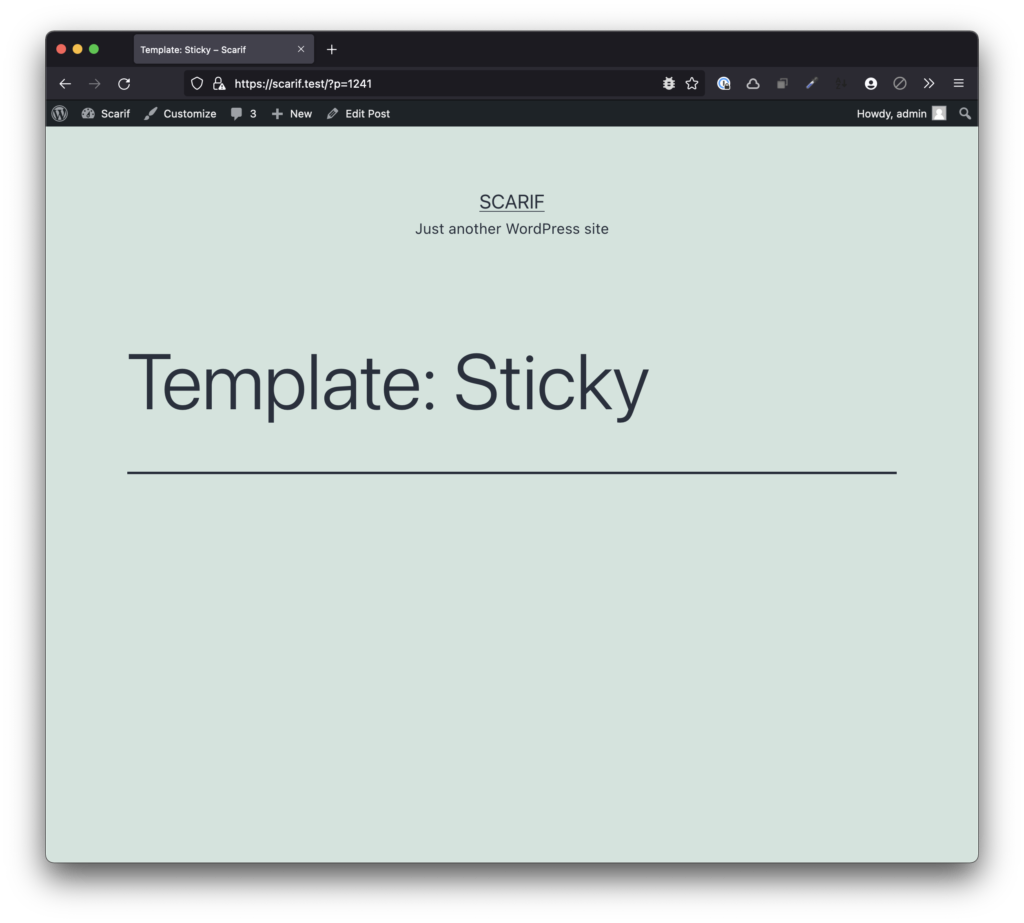
Note that when you pause execution, the browser will halt until you choose to Stop. If you Continue, then the rest of the plugin will function as normal; however, if you choose Stop then the script – and whatever else WordPress has to do – will come to a halt. This means you’ll be left with a blank screen like this:

Let’s try to give a bit of richer information as to what’s going on whenever we’ve halted the execution of our script.
In the code, add the following lines:
This should:
- Note that we’re halting execution,
- Show the caller of the function,
- Render the information about the ID of the instance of
WP_Userpassed into the function, - And will then halt execution.
From here, you can continue to execute the plugin or stop.
It’s a Primer
Obviously, simply pausing execution of a script in Ray as not as advanced as what you can do with a debugger but that doesn’t mean you can’t make it more powerful.
For example, just like we’ve seen above, the debugging functionality Ray provides coupled with the features we’ve discussed thus far allow us to:
- send a message to Ray,
- render data and data structures and their values,
- determine if the function in which you want to pause is truly reached,
- evaluate the caller of said function.
Later, we can even trace the functionality we’ve seen.
🔂 At this point, it should be no surprise there’s more we can do. Case in point, just as we’re about to approach a loop of capabilities in the code, Ray can provide insight on the the status of that loop.
That’s content for another post, though.
🔖 Remember The Tag
Recall I’m using the develop branch of the repository for each article. After the article, I’ll merge the contents of develop into main and then I’ll tag the version with the date the article was publishing.
The tag for this article will be 25012022.
We’ll continue to look more into what Ray can do for us within WordPress in the next article.
☕️ Enjoying this guide? Consider Buying Me a Coffee to support these longer form articles!
