I’ve recently switched to Laravel Herd for local development. It uses Valet internally, which I obviously like, and comes with a lot of tools out of the box that make some of the overhead of development much easier.

And any utility that makes it easy to focus on actually writing code while reducing anything that deals with reading logs, configuring different versions of PHP, and even debugging is something I’m in favor of using.
Off the shelf, Herd makes debugging with PHPStorm easy; however, if you’re to get started with Laravel Herd, Xdebug, and Visual Studio Code then there’s a little more configuration to do.
Laravel Herd, Xdebug, and Visual Studio Code
A Word About Herd Documentation
I want to point out I think Herd’s documentation and file structure is one of the best I’ve seen. It’s easy to understand, easy to navigate, and easy to find various configuration files – say php.ini or debug.ini – regardless of the version of PHP you’re using.
Case in point, see the following pages:
- Manage PHP versions
- Xdebug
- Additional PHP Extensions
- Logs
- …and there are more.
That said, there’s not much in the way of how to configure Xdebug and Visual Studio code.
Herd, Xdebug, and Code
Here are the steps what worked for me to get my local environment setup. Note this was tested with PHP 7.4, 8.0, and 8.2.
For the following example, note I’m using Apple Silicon and am going to be using PHP 7.4. Very few things should be different save for the paths to the files references in the below code.
HERD
Changing PHP versions is trivial in Herd. This is a matter of selecting the version you want to install and/or marking it as active for your current site.
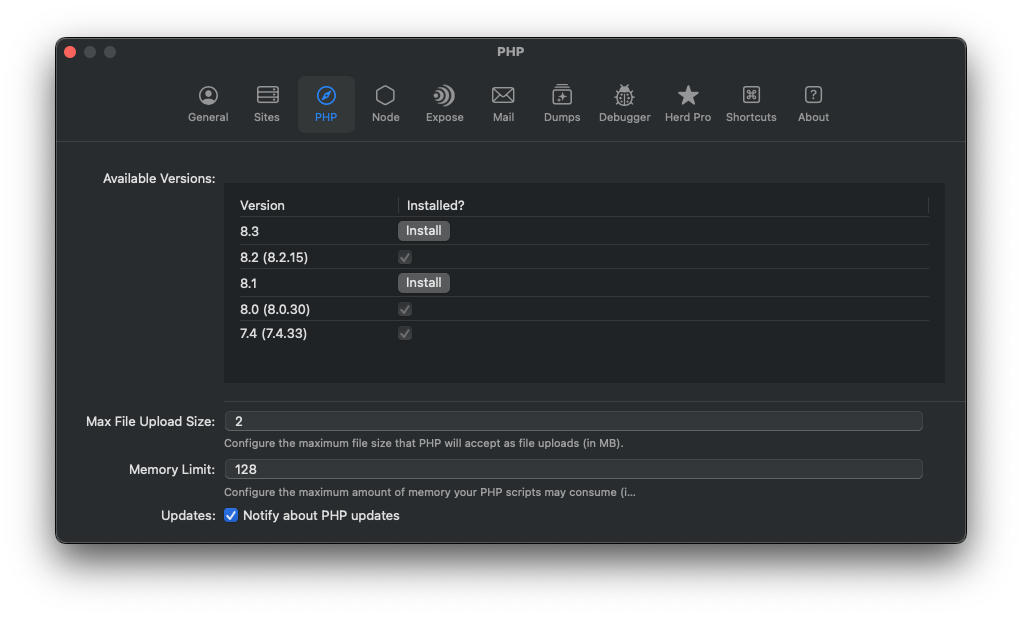
I mention this though, because it’s important to know which one you’ve got activated so you can properly update the relative Xdebug configuration.
XDEBUG
Unless you’ve set up Herd in some abnormal manner, you should find the extension in the following path:
/Applications/Herd.app/Contents/Resources/xdebug/xdebug-74-arm64.soFrom here, you want to open the relative php.ini file and add the following. Note that this is different than what the Herd docs show. I don’t know if it’s because they are specific to PHPStorm or not, but this is what worked for me with Visual Studio Code.
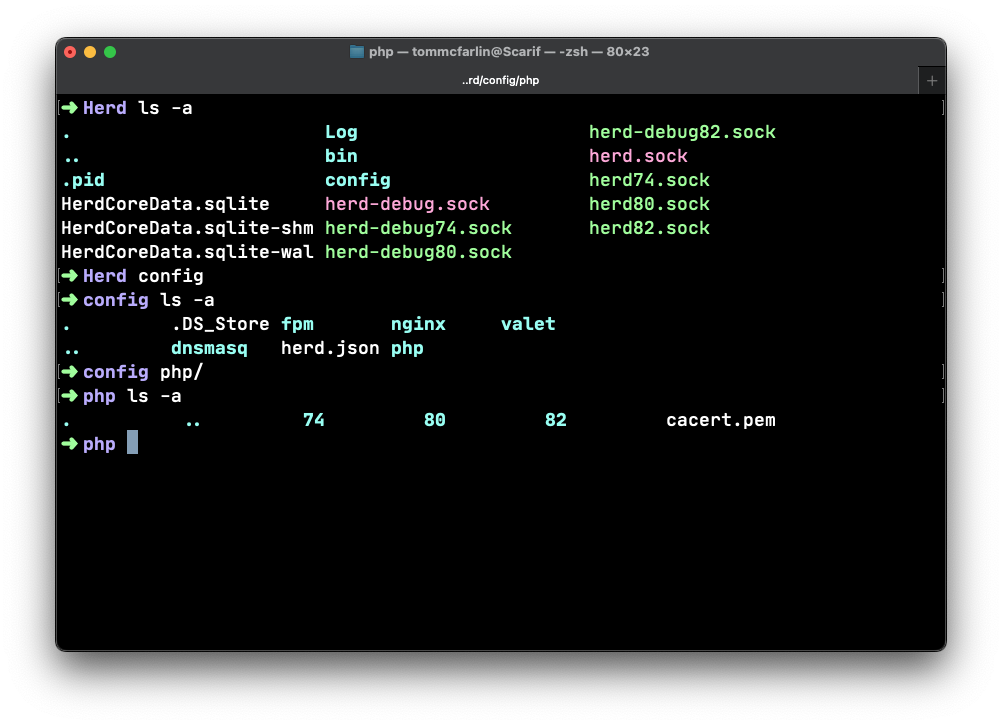
First, locate the php.ini file in the following path:
/Library/Application Support/Herd/config/php/74/Then append the following to the file:
zend_extension=/Applications/Herd.app/Contents/Resources/xdebug/xdebug-74-arm64.so
xdebug.mode=debug,develop
xdebug.start_with_request=yes
xdebug.start_upon_error=yes
xdebug.idekey=ECLIPSE
xdebug.client_port=9003
You should not need to touch the debug.ini related to the the PHP version in the same direction.
VISUAL STUDIO CODE
Finally, in Visual Studio Code, create a .vscode directory if it doesn’t already exist in the root of the project. Next, add launch.json to the directory.
In that file, add the following configuration:
{
    "version": "0.2.0",
    "configurations": [
        {
            "name": "Listen for Xdebug",
            "type": "php",
            "request": "launch",
            "port": 9003
        },
        {
            "name": "Launch Built-in web server",
            "type": "php",
            "request": "launch",
            "runtimeArgs": [
                "-dxdebug.mode=debug",
                "-dxdebug.start_with_request=yes",
                "-S",
                "localhost:0"
            ],
            "program": "",
            "cwd": "${workspaceRoot}",
            "port": 9003,
            "serverReadyAction": {
                "pattern": "Development Server \\(http://localhost:([0-9]+)\\) started",
                "uriFormat": "http://localhost:%s",
                "action": "openExternally"
            }
        }
    ]
}
You’ll likely need to restart Herd after this so issue the $ herd restart command in your terminal.
Conclusion
Now you should be able to set breakpoints, add watches, step into code, and all of the usual things you can do with the Xdebug but in a Herd environment.
And if you’re completely new to Xdebug, I wrote an extensive tutorial on it some time ago.