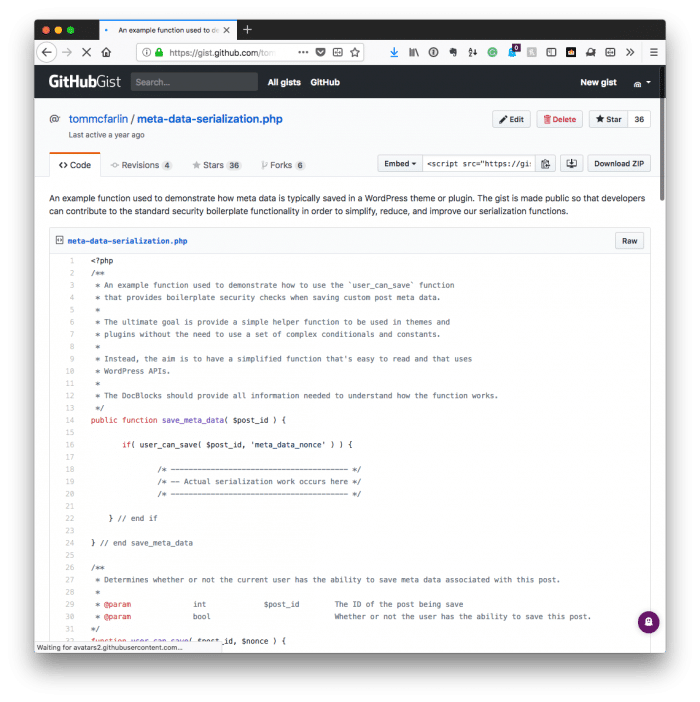
Years ago, I wrote a post in which I shared a public function to determine if the user had permissions to save information to the WordPress database. You can see the original gist in all of its aged glory (along with the solid comments) here (it’s five years old, even – wow).
As with anything programming related, time passes, things are refined, and things [hopefully] get better than they were before.
Though I still use and recommend a variant of the user_can_save (or userCanSave) function, I also think it’s important to go through the process of separating out the process of verifying the request.
So now it’s not just about determining if the user has permissions, but it’s about verifying the security information coming from the client – be it via a post back to the server or a request made via Ajax – and doing so using good programming techniques that align both with WordPress and with PHP.
To be clear, this is more about secure WordPress form submission from an options page or a settings page than it is, say, a form coming from a template. That’s another post for another time.
But still, there are plenty of us working on building applications on WordPress and that require the following.
Continue reading