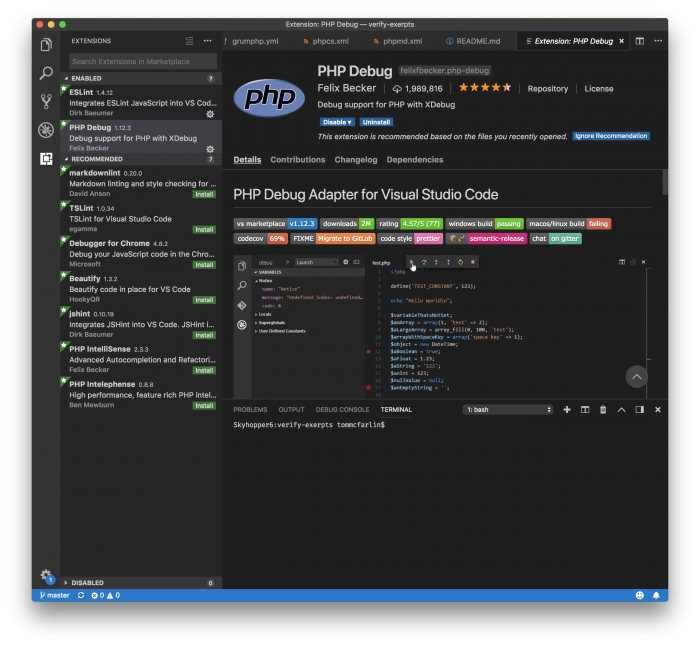
In the most recent post in this series, I walked through the process of integrating Xdebug with your IDE. And given that I’ve been using Visual Studio Code as my IDE of choice, that’s also the IDE I’m using as the example.

Furthermore, it’s cross-platform, easy enough to get started for beginners, but powerful enough to extend and operate for more experienced programmers (and for the rest of us who fall in between).
In the last post, I stated that I’d be doing a series of screencasts. Specifically, I wrote the following:
Starting in the next post, I’ll begin sharing some screencasts that walk through how to debug functions and variables, change values on the fly, work with the debug console, and more.
In this post, I’m going to have a short screencast providing an introduction to debugging WordPress the first part of this series. Namely, launching an instance of a site built using WordPress and using the basics of debugging a plugin.
An Introduction to Debugging
Because this screencast is the first in a series and because I don’t want to assume a person has previous experience, I’m going to start at the most basic level.
That is, I’m going to assume you have:
- a site set up and configured,
- the ability to access it in a web browser,
- a core set of plugins such as Hello Dolly that come with WordPress.
If you don’t have any of the following, please review the following posts:
- Installing WordPress for Local Development
- Installing Xdebug, Part 1: The Xdebug Module
- Installing Xdebug, Part 2: The IDE
Once done, you should have everything you need to begin walking through the process of actively debugging a running application.
Let’s Do Some Screencasts
The goal of the screencasts is two-fold:
- keep them short,
- showcase at least one practical thing you can take away from watching them.
Because I know we’re all busy and because I believe videos tend to take longer than they should reach a point, I want to try to be as concise and direct as possible when walking through an aspect of debugging.
Furthermore, since this is all meant to start from the ground-up, why not start with a plugin that’s included with WordPress? It’s something we all have, it will work with the content that’s already been written, and it’ll lay the groundwork for more advanced debugging.
Walk Through a Plugin
In this screencast, we’re going to look at setting a few breakpoints in Hello Dolly and inspecting the value of certain variables. That’s it, nothing more.
Later, we’ll get to more advance things that a debugger has to offer, but this starts with the basics. And the goal isn’t just to leave it with this plugin, either. Instead, it’s meant to show you how to leverage the tools we have available and then begin applying them in your work.
Up Next
In the next post, we’re going to look at more advanced things we can do such as stepping into functions, stepping out of functions, and stepping over functions.
After that, we’ll turn our attention to more advanced things such as watching variables throughout the lifetime of execution of a plugin and then how to change variables during execution.
For now, though, why not take some time to practice and set a breakpoint in a few different plugins are a few different areas of code in a WordPress-specific application?
