A few weeks ago, Pressmatic made a grand entrance into the WordPress development space with its unique positioning as a WordPress-specific development environment.
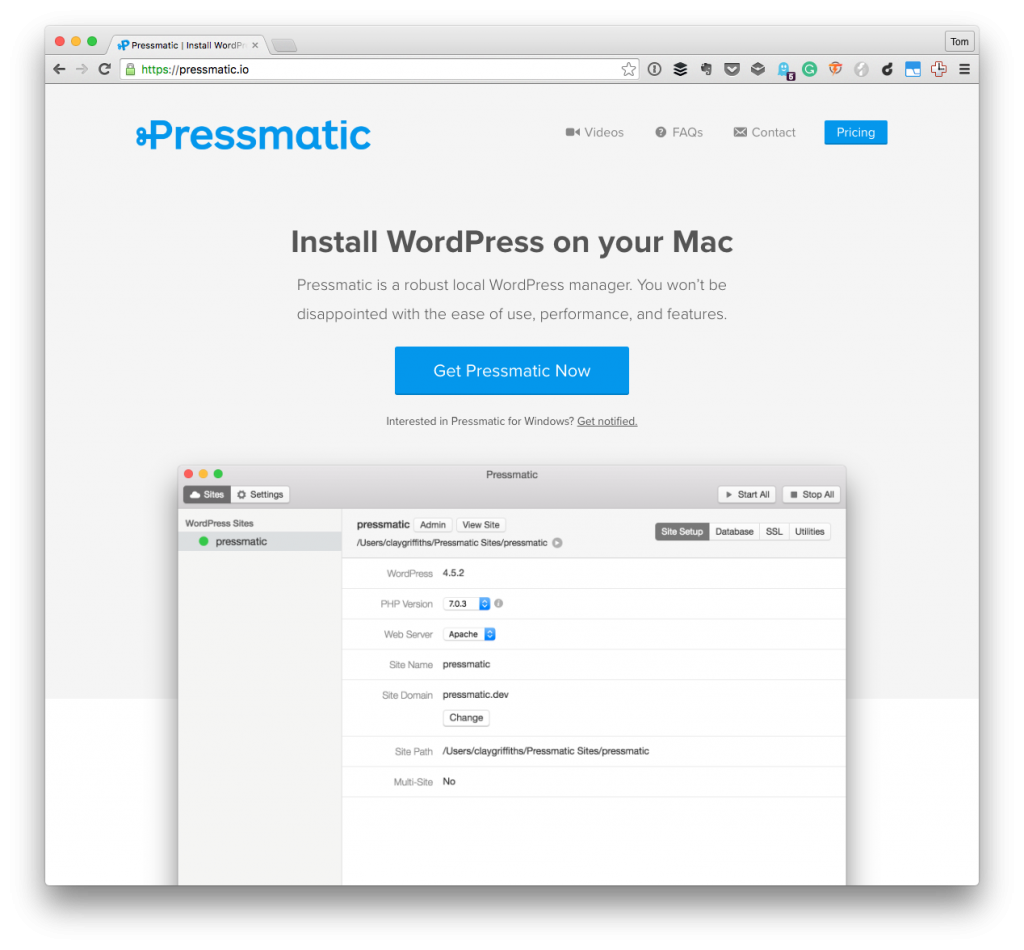
Specifically, it describes itself as such:
Pressmatic is a robust local WordPress manager. You won’t be disappointed with the ease of use, performance, and features.
I’ve been using it ever since (and talked about it in a couple of previous posts). Generally speaking, I’ve been really happy with one.
One of the features that it claims as a major benefit is:
One-click integration of Xdebug + PHPStorm.
And that’s great if you are using PHPStorm; however, those of you who’ve read this blog for any length of time within the past year or so know that I’m a fan of Codebug (which is essentially a front-end for Xdebug) and that I’ve made the switch to Atom.
So if you’re working with anything other than PHPStorm and you’re looking make use of Xdebug with Pressmatic, here’s a step-by-step guide for how to do so.
Xdebug with Pressmatic
In this post, I’m assuming you’re aware of what Xdebug is – if not, there’s plenty of material to read. In short, it’s a way to debug PHP-based applications.
Understanding Pressmatic
Before going too far, it’s important to understand how Pressmatic works in order to make sure that you’re able to follow the configuration options that I’ll share later in this article.
- For each new site that you set up, Pressmatic sets up a new virtual machine using VirtualBox where your site is located.
- This means that when your computer makes a request to a server to load up the site, it thinks it’s talking to another computer when, in reality, it’s just talking to a virtual machine on your local computer.
- The operating system is a version of Ubuntu and then it uses Apache or Nginx and a version of PHP depending on which you’ve selected when initializing your machine.
- All of the configuration is kept in
/site/conf/php/php7.0.3/php.ini(though your location may vary where “site” is the directory you created and “php7.0.3” corresponds to the version of PHP that you’re using.
With that said, you now have what you need to know in order to work with some of the PHP settings that are needed to get Xdebug configured and working.
Before doing that though, it’s important to get two other pieces of information.
How Your Machine Sees Your Pressmatic Site
When you set up a domain such as wordpress.dev, that address will resolve to an IP address exactly as it would as if it were located on the Internet.
The primary difference, of course, is that a machine is a virtual machine on your computer. Knowing this IP address is import when configuring Xdebug. To determine what the IP address of the virtual machine is, you can ping the domain as if you would any other site.
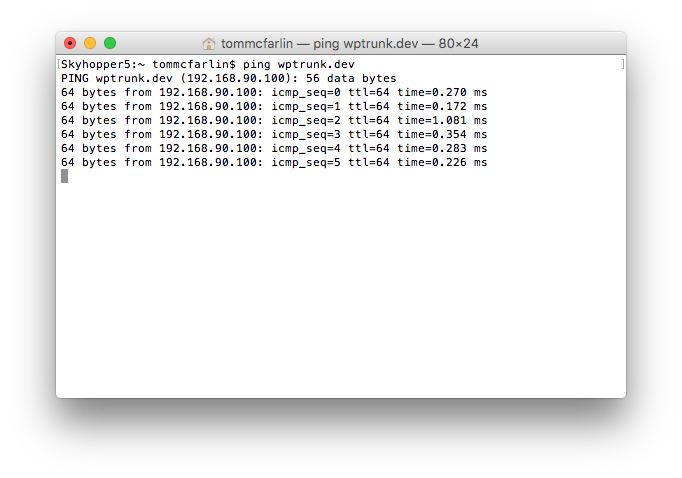
That IP address will come in handy when we’re ready to begin configuring Xdebug.
The Local and Remote Paths of Your Server
The other neat thing about Xdebug is that it allows for remote debugging. This means you can actually debug code on a remote server rather than just code that resides on your local machine.
And, since we’ve established that this is virtually happening on your local machine, we need to be able to map our local paths to our remote paths. Perhaps an easier way to explain this is like this:
- The directory structure of the WordPress installation on your local machine is just like what’s on the remote machine (or, rather, the virtual machine).
- The primarily difference is that the local of WordPress is different so we need to be able to specify the local path (that is, where it’s located on your machine) and where WordPress is located on the remote machine.
To find the location of WordPress on the remote machine, you can SSH into the machine using the easy-to-use option that Pressmatic provides. Simply right-click on the side in the control panel and then choose Open Site SSH.
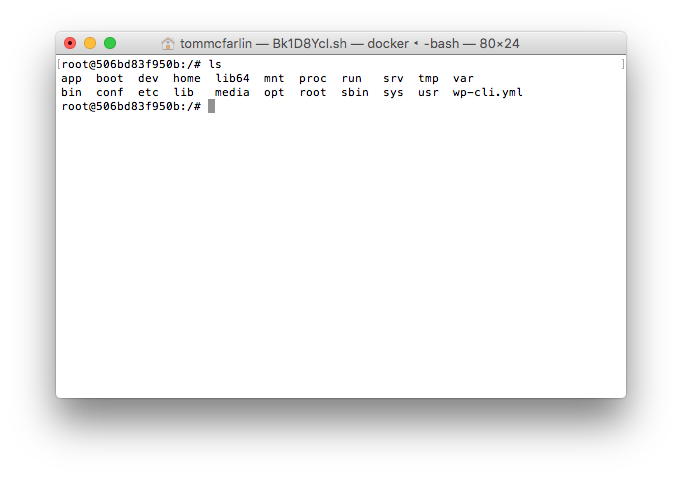
This will open a terminal window in which you have a connection to the remote machine. From there, you can list out the directories by issuing an ls command. Once you do that, you’ll notice an app directory.
Change directories into app and you’ll notice that you see almost exactly the same structure as you’ve seen on your local machine. That is your remote path.
Configuring Xdebug
At this point, you have everything you need to configure Xdebug. First, note that the configuration provided for Xdebug by Pressmatic out of the box looks something like this:
However, I needed to make a few changes (namely specifying the remote IP address) to get this working. So the final version of my configuration file looks like this:
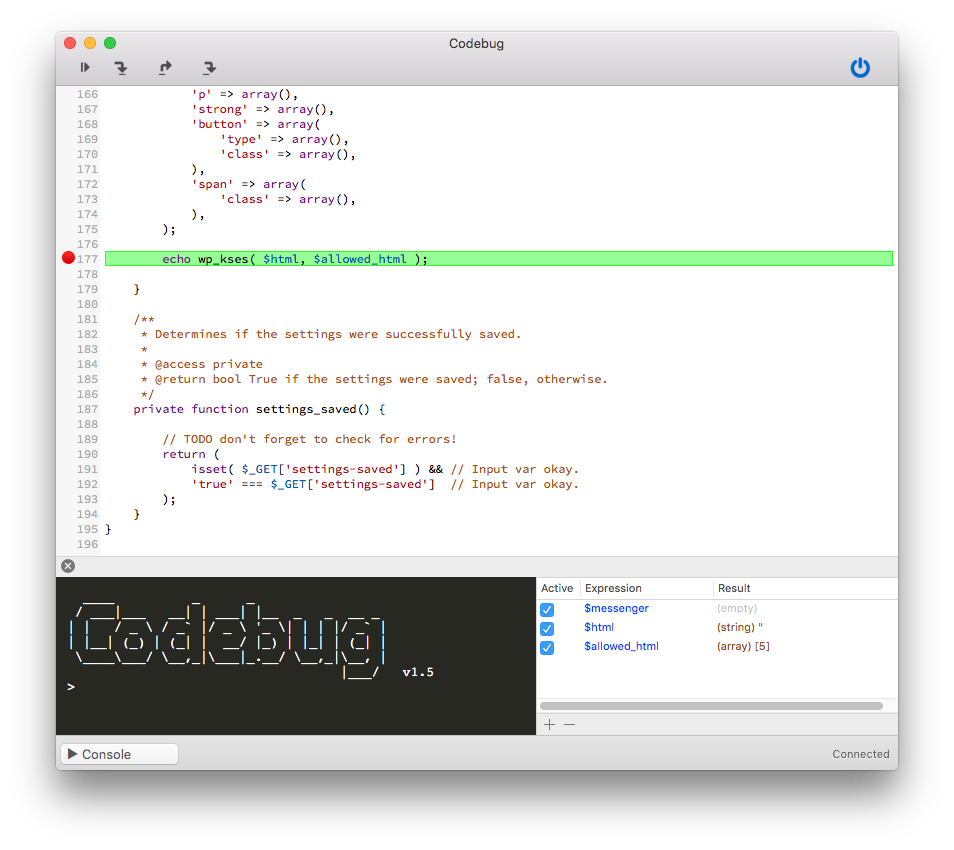
Next, I defined both the local and the remote paths of my project in Codebug.
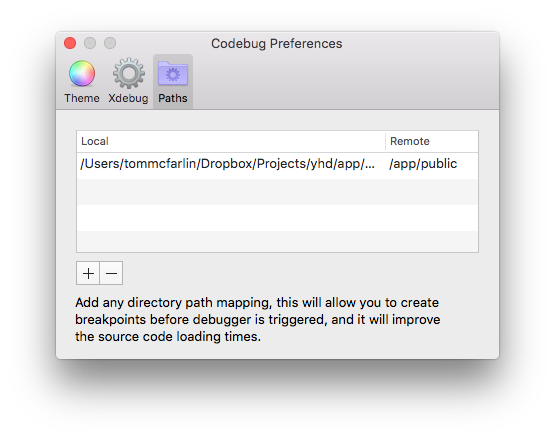
Some say this isn’t necessary, but it can result in performance increases. Though you may not use Codebug (and there are plenty of other alternatives that are available – including those that integrate with Atom), you’ll still likely need to know the remote paths and the local paths.
At this point, I was up and running with debugging my WordPress-based projects.
Though your IDE and debugging environment may vary, if you’re using Pressmatic and are looking for a way to regain control of debugging, the steps above should provide everything you need to know to get back to using a debugger.
I do not recommend sticking with print_r, var_dumps, and echo statements as that’s simply dumping out information for inspection. Debugging can be much more powerful.
But that’s content for an entirely different post.
Leave a Reply
You must be logged in to post a comment.