In previous posts, I’ve talked a bit about why using a proper debugger versus some of PHP’s built-in statements are important. In the last post, even, I walk through how to set up Xdebug with Visual Studio Code (and MAMP Pro, if you’re using).
But if you’ve never used a tool like this before, you’ve never seen how it works, or you’ve never seen why it’s so powerful, I want to cover that a bit in this post.
So I’m going to be walking through a bit of doing this within the context of a few definitions and screenshots as well as a short screencast at the end so I can show the Visual Studio Code debugger working in action.
The Visual Studio Code Debugger
Assuming, you’ve got the debugger installed; there are a few terms that are worth learning. Sure, there are more, but these are the ones I consider key:
- Breakpoints are where you’re telling the program to halt its execution. Once the code has stopped at this point, you can examine variables, see what values are stored in memory, and so on.
- Watches are variables in the code that you want to literally watch as they change throughout the variables execution.
- Start sets the debugger in motion. Even if you have breakpoints and watches set, the debugger isn’t going to do anything until you start it.
- Step Into is an action that, when you hit a function call, will take you into the function that’s being invoked. Sometimes this is useful, like if you want to see what the function is doing; other times, it’s unnecessary if you just care about the function executing or you only care about what it returns.
- Step Over will allow you to step over a function’s execution such that the execution of the program will stop immediately after the function that you’ve stepped over has finished.
- Step Out is used when you’ve stepped into a function, hit a point where you’re done evaluating the code, and then ready to step back out to where you had set a breakpoint.
- Stop will terminate the execution of the debugger.
Sounds relatively clear, doesn’t it? In my opinion, it’s easiest to see this in action.
Furthermore, to see which icons do what, usually the best thing to do is to hover over them and then read the tooltips; however, after a time or two of using them, you’ll be familiar with what each does.
After all, the icons are pretty descriptive.
An Example
With that said, assuming that you’ve followed the steps in the previous article, here’s a short example as to how you can set a breakpoint and follow it’s execution through a plugin.
1. Breakpoint
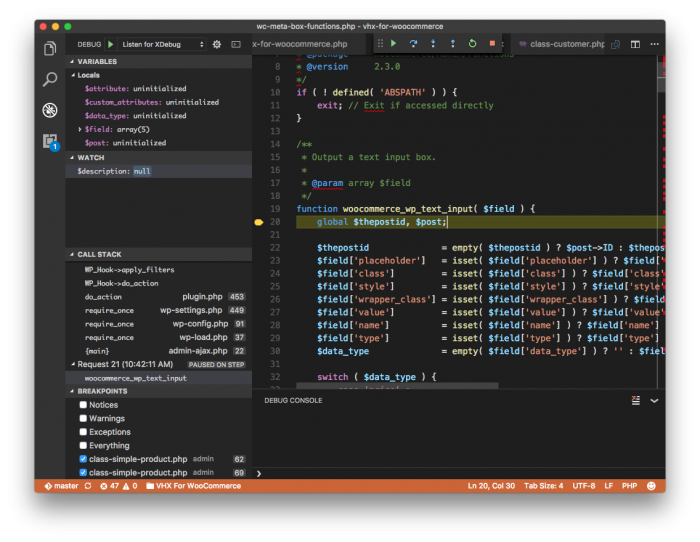
Notice in the image below, I’ve placed a breakpoint beside a line of code (as indicated by the red dot).
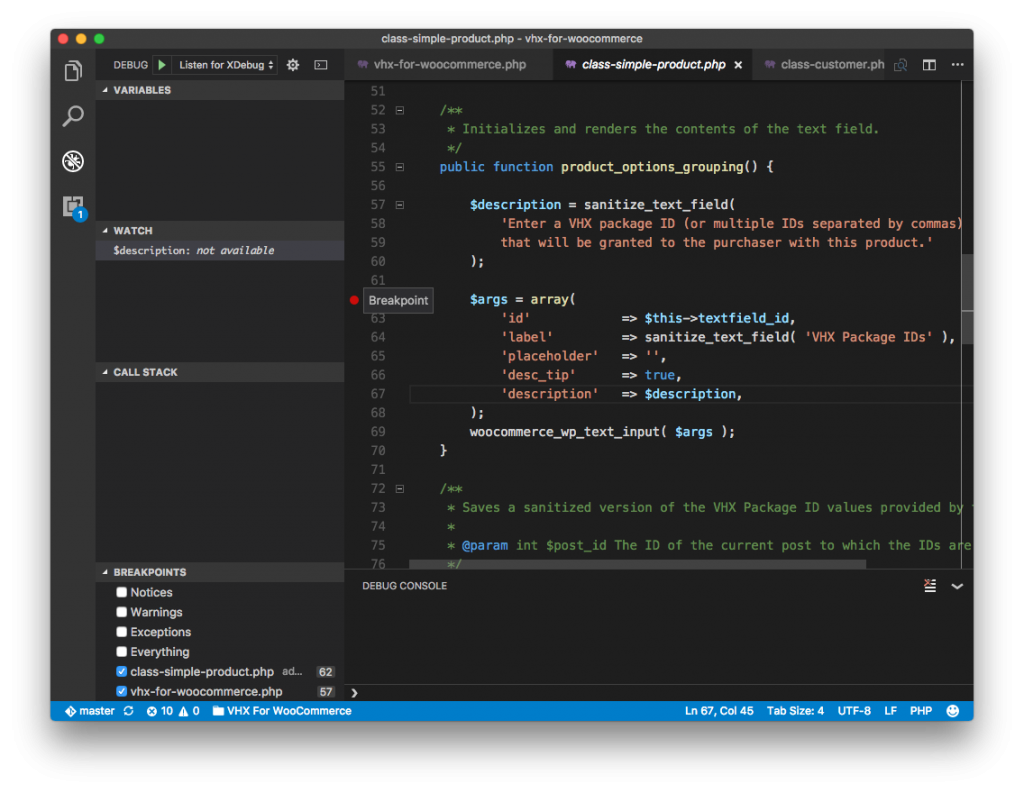
This is where execution is going to stop once I start the debugger and begin executing the program.
2. Set a Watch
Next, to watch a variable means that we want to see the value of a variable throughout the lifecycle of the program. Below, I’m adding a watch to the $description variable.
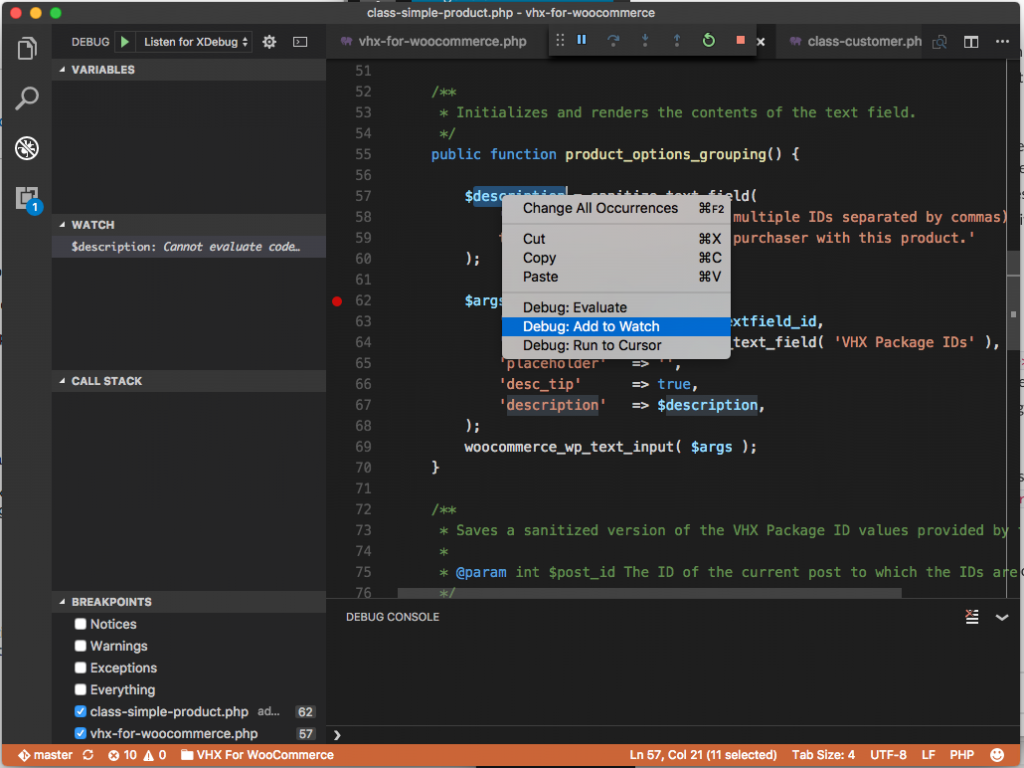
In the next section, you’ll see the value of the watch after the execution of the program passed that line of code.
3. Evaluate the Watch
Once the code has passed that line, you can see the value of the variable in the Watch section of the debug pane.
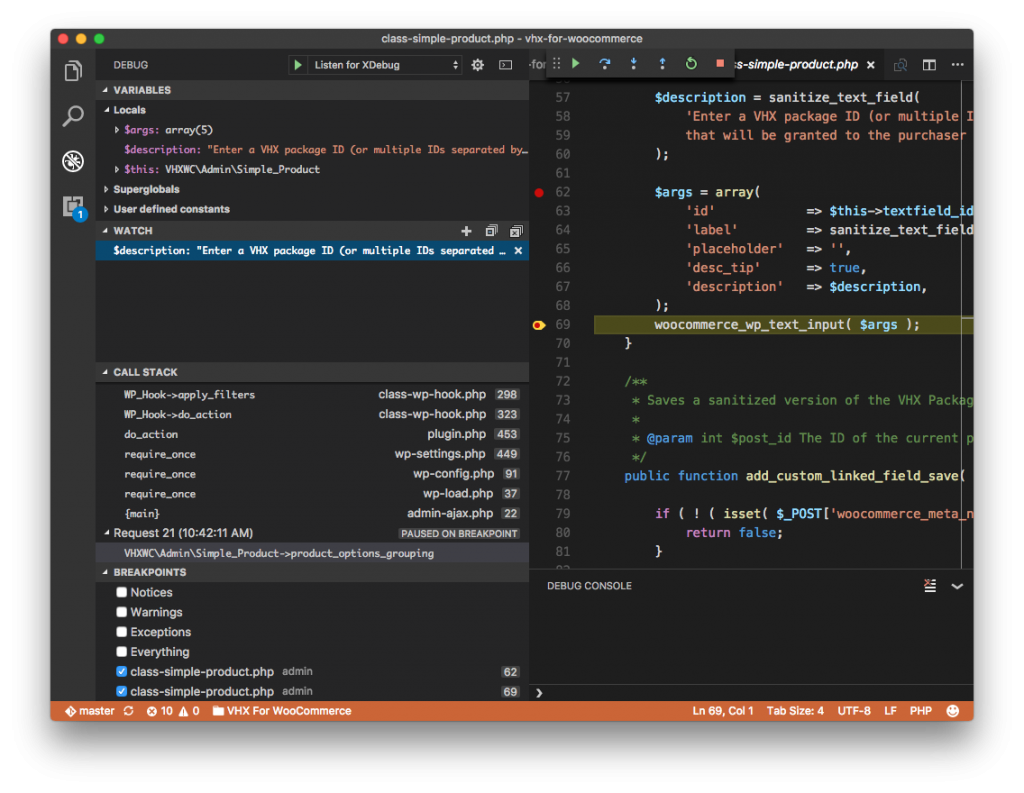
Notice in the function, there is a call to woocommerce_wp_text_input. We’ll use this function as an example to step into a function since it’s a function that’s part of WooCommerce core.
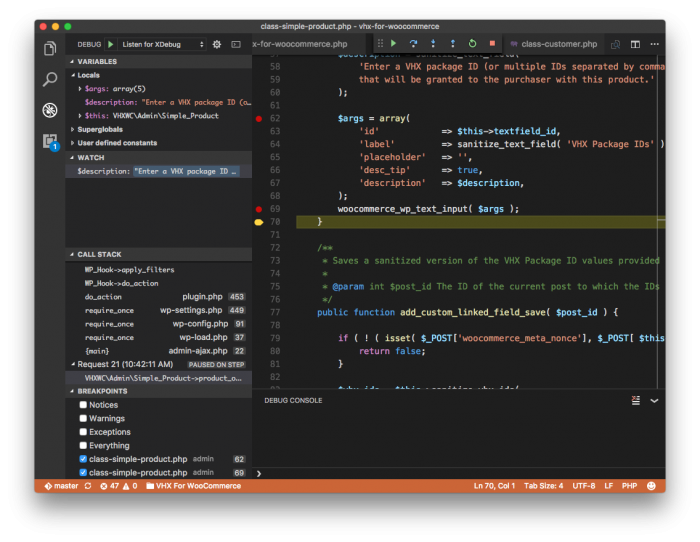
4. Prepare to Step In
Before stepping into a function, it’s important to make sure the function name is highlighted.
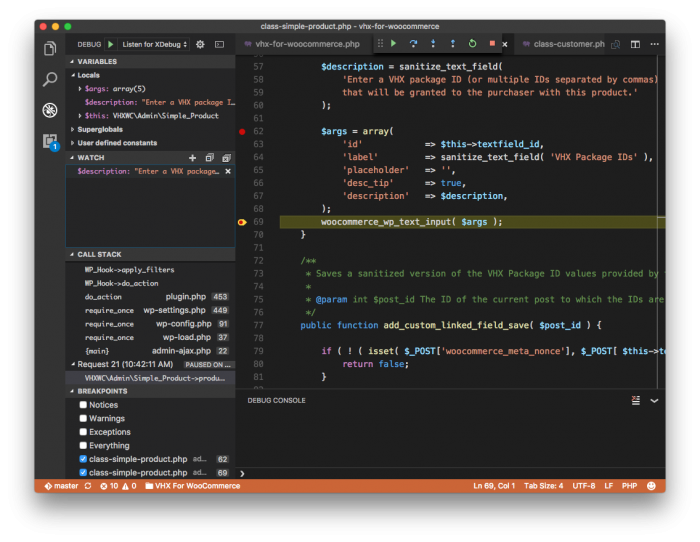
Once done you’ll be able to click the Step In button to see what’s happening in the function.
5. Step In
After stepping in, you’ll see code that you didn’t write. Instead, it’s code that’s part of WooCommerce (at least in this example).
Based on your experience, you’ll see code that perhaps you wrote or that someone else wrote.
6. Step Out
Once you’ve stepped out of the code, then you’re going to return to the line of code immediately after where you stepped into the code.
Make sense?
A Screencast
And finally, here’s a very brief screencast walking through what all of the above looks like in action:
As mentioned in the video, this is by no means comprehensive, but it should be enough to show just how powerful debugging can be.
It Takes Times and Practice
Debugging takes a bit more time than dumping variables out to the screen.
And I’m not saying that doing that doesn’t have its place; however, if you want to gain a deeper understanding what’s happening whenever you’re running your program, or you want to explore, say, WordPress core, then using a debugger is a really good way to do that.
Furthermore, I’d argue that using a debugger can help give a greater understanding as to what is going wrong (or right) within the context of your code so that you’re able to create the best possible solution for it.
