There are a number of different ways that you can setup a debugging WordPress projects. It may be in the form of an IDE, it may be in the form of another application like MacGDBp, or it may be in the form of using something that fits your workflow.
Whatever the case, when a project reaches production, you normally don’t have access to any of the above. Instead, you’ve access to error logs. Obviously, they’re really useful when needing to, say, follow a stack trace for any given warning or error.
Sure, it sucks not being able to attach a debugger to your code on the server-side and then trace where the problem is, but given log files and pouring over enough information, you should be able to (well, at least hopefully) reproduce the error in both development and staging.
As such, I think it’s valuable not only to have quick access to error logs for WordPress in your staging environment but in your development environment, as well.
Debugging WordPress Projects
When you’re working in development, there are plenty of plugins and strategies to help to help debug an issue. This includes anything from using simple print_r statements through your code to using WP_DEBUG in your WordPress configuration file.
But when it comes to looking at an error log on the server – either for staging or for production – I find that it’s also useful to have quick access to the error logs on your local machine because if you’re able to compare what’s happening on the server with what’s happening on your local machine, then it’s much easier to isolate the problem rather than trying to feel around in the dark trying to isolate the issue.
To do this, there are several steps to set this up on your local machine.
1. Define The Error Reporting Level
You can read more about this in the PHP manual, but I recommend making sure that you have at least error_reporting(E_ERROR | E_WARNING | E_PARSE); defined.
Of course, for the strictest reporting (for which I personally think there’s reason to have this on), you can always define error_reporting(E_ALL);
2. Setup a Shortcut to the Logs Directory
Next, depending on how your server is configured, odds are that your logs directory is buried somewhere in a subdirectory of a subdirectory of an application directory somewhere on the filesystem.
To give quick access, I add a shortcut to the sidebar in Finder:
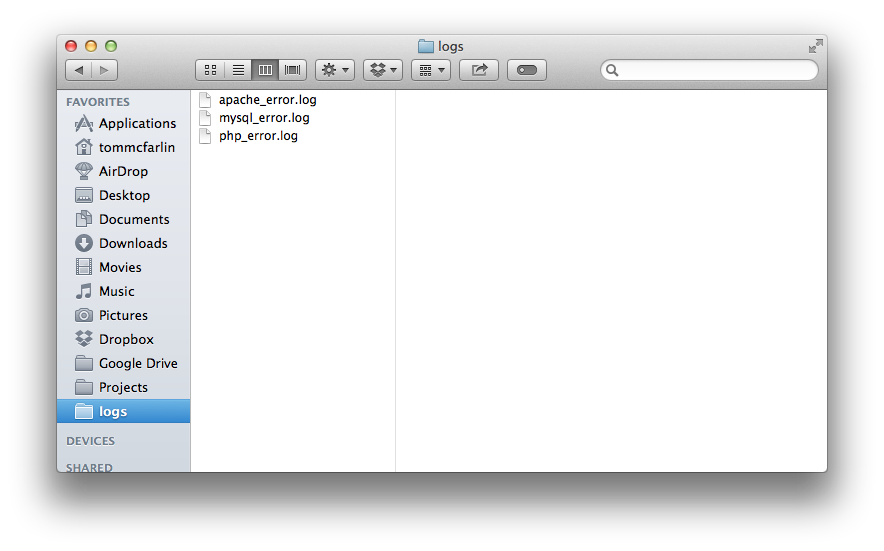
This makes access the logs directory so much faster.
3. Open The Logs with the Console
Finally, I make sure that I open all of my logs with the console application that’s included with OS X.
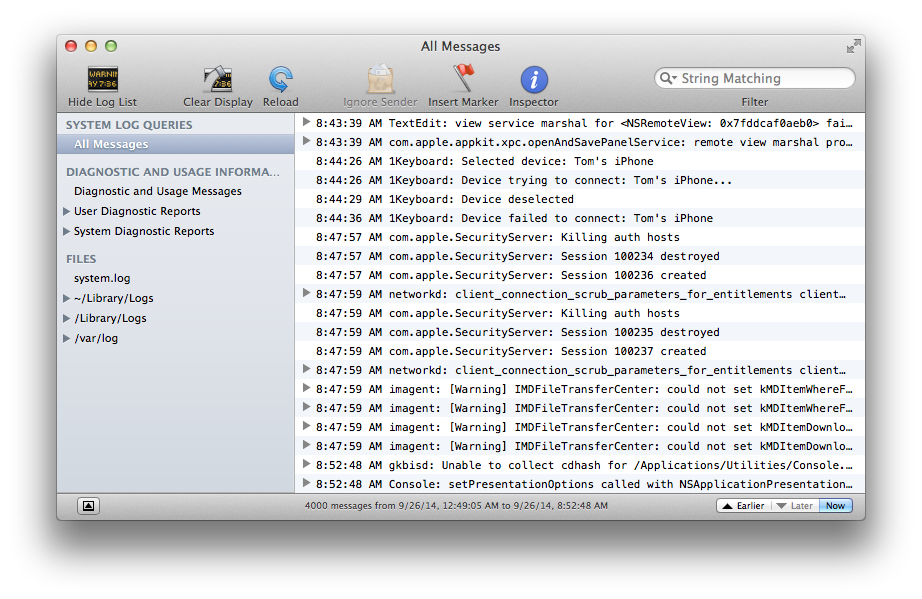
Of course, regardless of what operating system you use, anything that can render plain text works just as well.
Being able to compare the data that you see in the logs with what you see in staging and production can go a long way in being able to trying to pinpoint an issue that other debugging statements may not sure.
It’s Not Mutually Exclusive
Of course, all of this is meant to work hand-in-hand with one another. That is, none of these are meant to be independent of one another – especially in development. Make sure that you have a debugger, the ability to trace code, and the ability to view information in the log files.
Those three things go a long way in making it much easier to make sure you’re writing error and warning free code while also being able to successfully debug whatever may be happening.

Leave a Reply
You must be logged in to post a comment.