There are a number of ways that we debug our WordPress-based projects.
- Some people end up going through the code and setting up `print_r` statements or `var_dump` statements
- Some end up working through the code and changing variables or function names until they find where something breaks (or changes)
- Some use debugging software (or the debugging features in their IDE)
- Some use a combination of plugins and other techniques
- And some likely use some strategy that isn’t listed here
Personally, I’m partial to using some of the developer tools that are provided by WordPress through the use of setting constants and using plugins that are available to us, but I’m also a fan of using Codebug App (which is the content for another point).
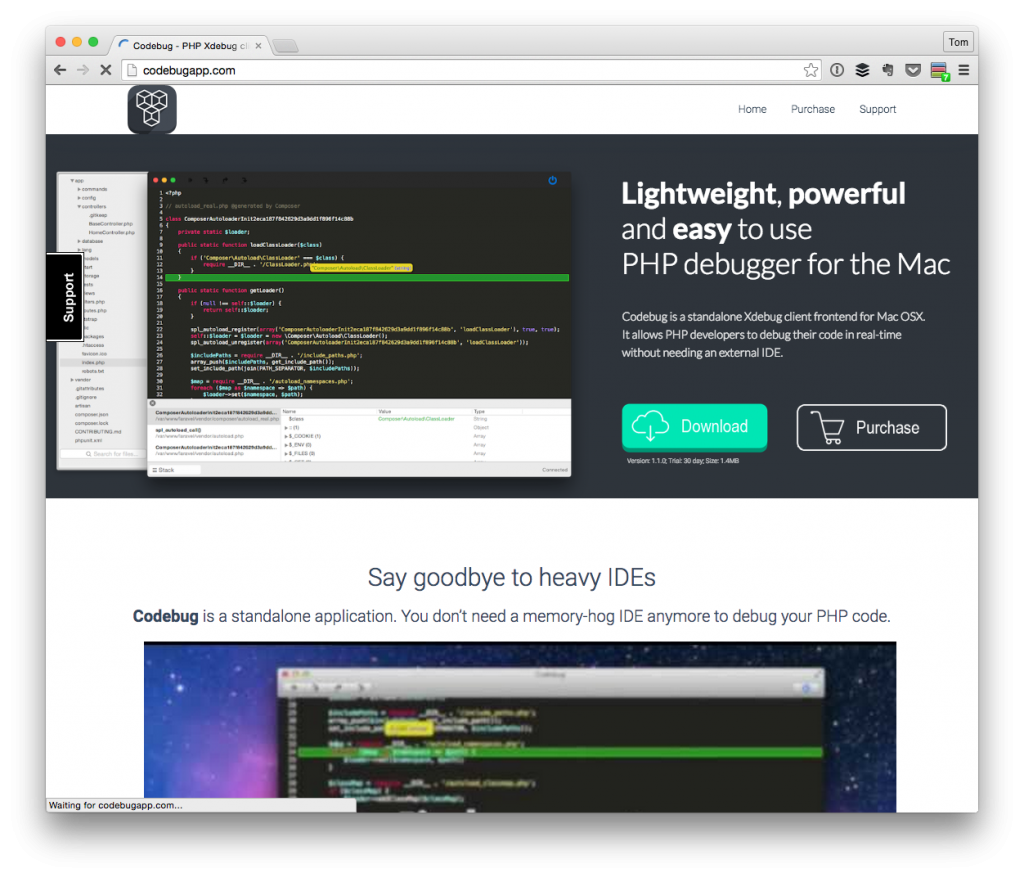
But, for the purposes of this post, that’s beside the point.
Occasionally, it’s possible that you do everything you can in order to make sure your application is as resilient as possible as it relates to releasing it to your production server.
The thing is, you never really know just how users are going to use your work until you get it in front of them. And sure, performing user group testing and all of that is really invaluable, but it’s impossible to catch every case for how a person may end up using the application.
Or perhaps you inherit the work of another user and someone has tasked you with having to isolate, diagnose, and ultimately fix the problem.
How do we go about doing that?
Obviously, I’m a big fan of the tools that are above, but I also think there are places that allow us to start in order to begin narrowing down the culprit that may be causing the problem.
Specifically, I think that it can be useful to use query string parameters to help uncover what’s happening behind the scene before we start setting breakpoints. To be clear, this isn’t something that I recommend that we do as a regular best practice, but it can be starting point on peaking into what’s happening on the server side.
By this, I mean we set a query string flag. We check to see if it’s a set and, if so, then we render information to the screen.
This way, we have a way to quickly print out information that may be relevant to what we’re trying to fix.
We also have control on how long (or how short) the flag is and though it’s likely highly likely that someone else is going to come along and find the query string in the short window with which we’ll be using it, it’s worth noting that this isn’t something that you should continue to use as it does leak data and can be more detrimental than helpful to your work in the long run.
Until then, this is a reasonable first step to debugging a code base that you’ve inherited or isolating a problem until you have the ability to use more advanced tools for digging into the issue to fix it.

Leave a Reply
You must be logged in to post a comment.