Using Xdebug and Visual Studio Code is something that’s pretty easy to setup, but given that I’m still using Visual Studio Code should tell you something about how much I’m a fan of the IDE.
But here’s the thing:
If you’re a WordPress developer, debugging is something that you really need to learn. That is, don’t use print_r and var_dump if you can help it. Use a legitimate debugger. It will help you think as the interpreter thinks and it will help you learn a bit more about Core.
Now that I’m off my soapbox, getting the necessary tools installed is easy. The article assumes you’re using MAMP Pro (since that’s what I use), but if you have access to php.ini then you’re going to be able to follow along.
Xdebug, Visual Studio Code, and Setting It Up
For those who haven’t heard of Xdebug before, think of it as a piece of software that allows you to pause your program while it’s running and see the values that variables have, what method is being executed, the call stack, and so on.
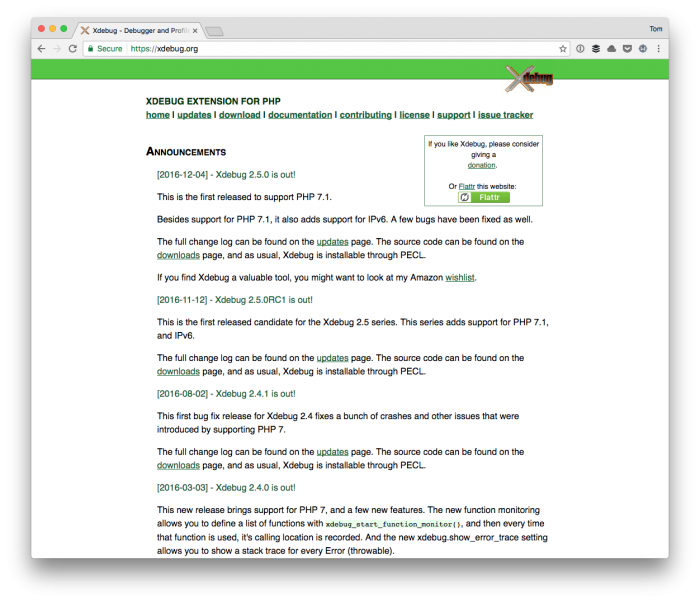
You can read more about it on the homepage, but here’s the gist of it:
A PHP extension for powerful debugging. It supports stack and function traces, profiling information and memory allocation and script execution analysis.
I know – memory allocation, script execution analysis, etc. sounds kind of boring if you’re not into that sort of thing, but the value that you get from running something like this cannot be understated.
That said, here’s how to get it working with MAMP and Visual Studio.
1. Configure MAMP Pro
For the sake of WordPress’ base requirements, I’m going to assume you’re using PHP 5.6.28 (but the steps work the same regardless).
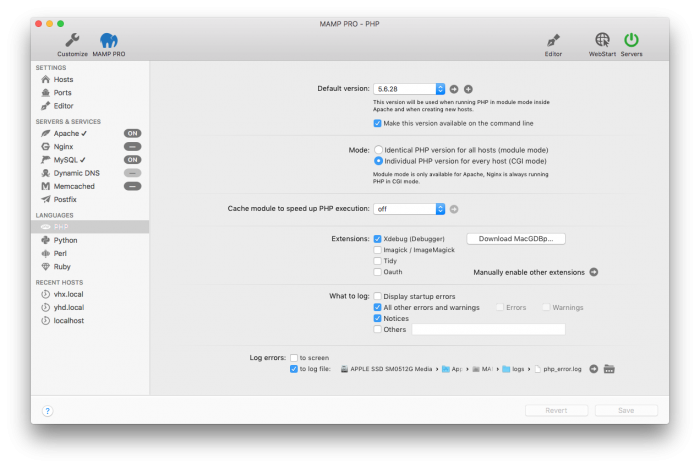
First, make sure that Xdebug is enabled from within the MAMP Pro dashboard.
Next, from the MAMP Pro menu, choose Edit Template > PHP 5.6.28 and then locate the area in the template file for the PHP configuration where Xdebug is located:
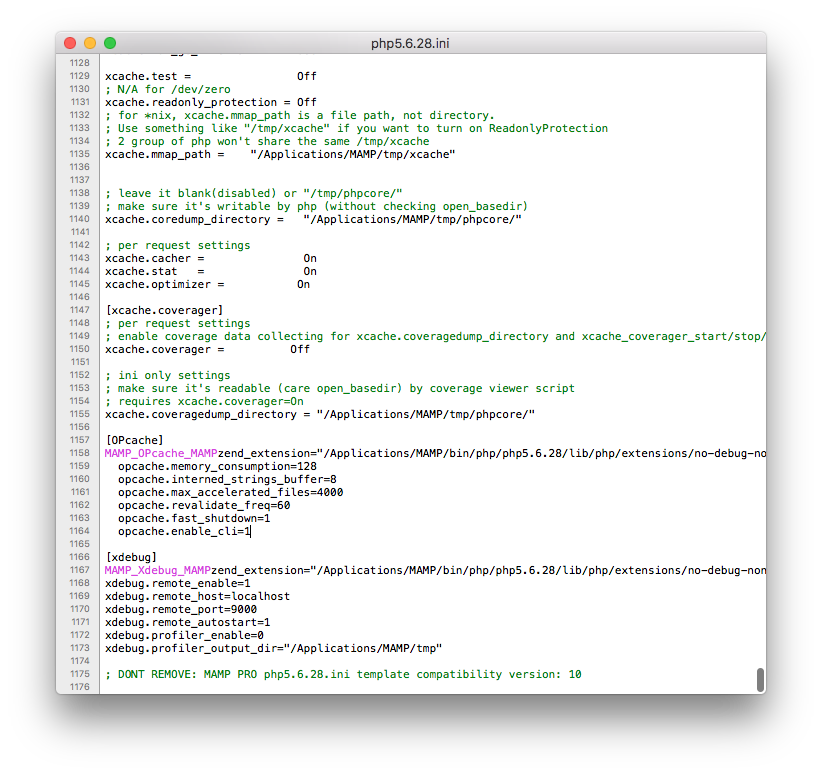
Make sure that it looks like this:
After saving it, MAMP Pro might prompt you to restart. If that’s the case, then do so. Even if it doesn’t, I recommend making sure that you do restart.
2. Configuration Visual Studio Code
Next, in Visual Studio Code, navigate to the Extensions pane and search for PHP Debug. Install it and activate it.
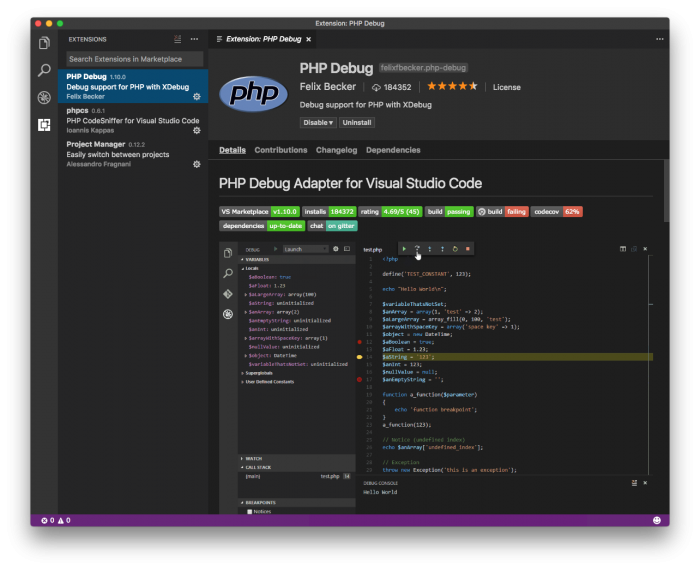
Once done, you may need to reload the IDE. Even if it doesn’t prompt you to do so, I recommend it. From there, Xdebug is installed and you’re ready to start debugging.
How Do I Debug?
This requires a little bit more of a walkthrough that I’d like to share in this post. That is, this post is short but the time to get things set up is a little bit longer.
So in a follow-up post, I’ll walk through how to debug some of your own code and you can see it in action.